JTAG Hacking with a Raspberry Pi - Introducing the PiFex
May 2024
Overview
When performing initial hardware analysis and recon, I have become very fond of using Armbian-based single-board computers (SBCs) for things like UART, SPI, I2C, JTAG, and SWD. One of the main benefits of using one of these boards is that since the peripherals we are interested in are exposed as character devices in Linux, a wide variety of tools are available for interfacing with them, including most programming and scripting languages.
However, one of the biggest hurdles that stop people from using an Armbian-based device is the initial setup and configuration (not to mention availability!). It takes more time to configure an Orange Pi or Raspberry Pi and enable the various interfaces than plug in an FTDI to your Linux machine. This blog post will help break down some of those barriers and streamline the setup process for those looking to learn hardware hacking with a Linux SBC.
With this blog post, we’ll introduce the PiFex, a basic companion board for the Raspberry Pi designed to teach users the basics of hardware hacking and embedded protocols. We will then demonstrate how to use the PiFex to access a JTAG tap on an undocumented SSD, allowing memory reads and GDB access to the SSD CPU.
Note: The design and software for the PiFex will be open-sourced in the coming months as we continue our final rounds of testing
Background Information
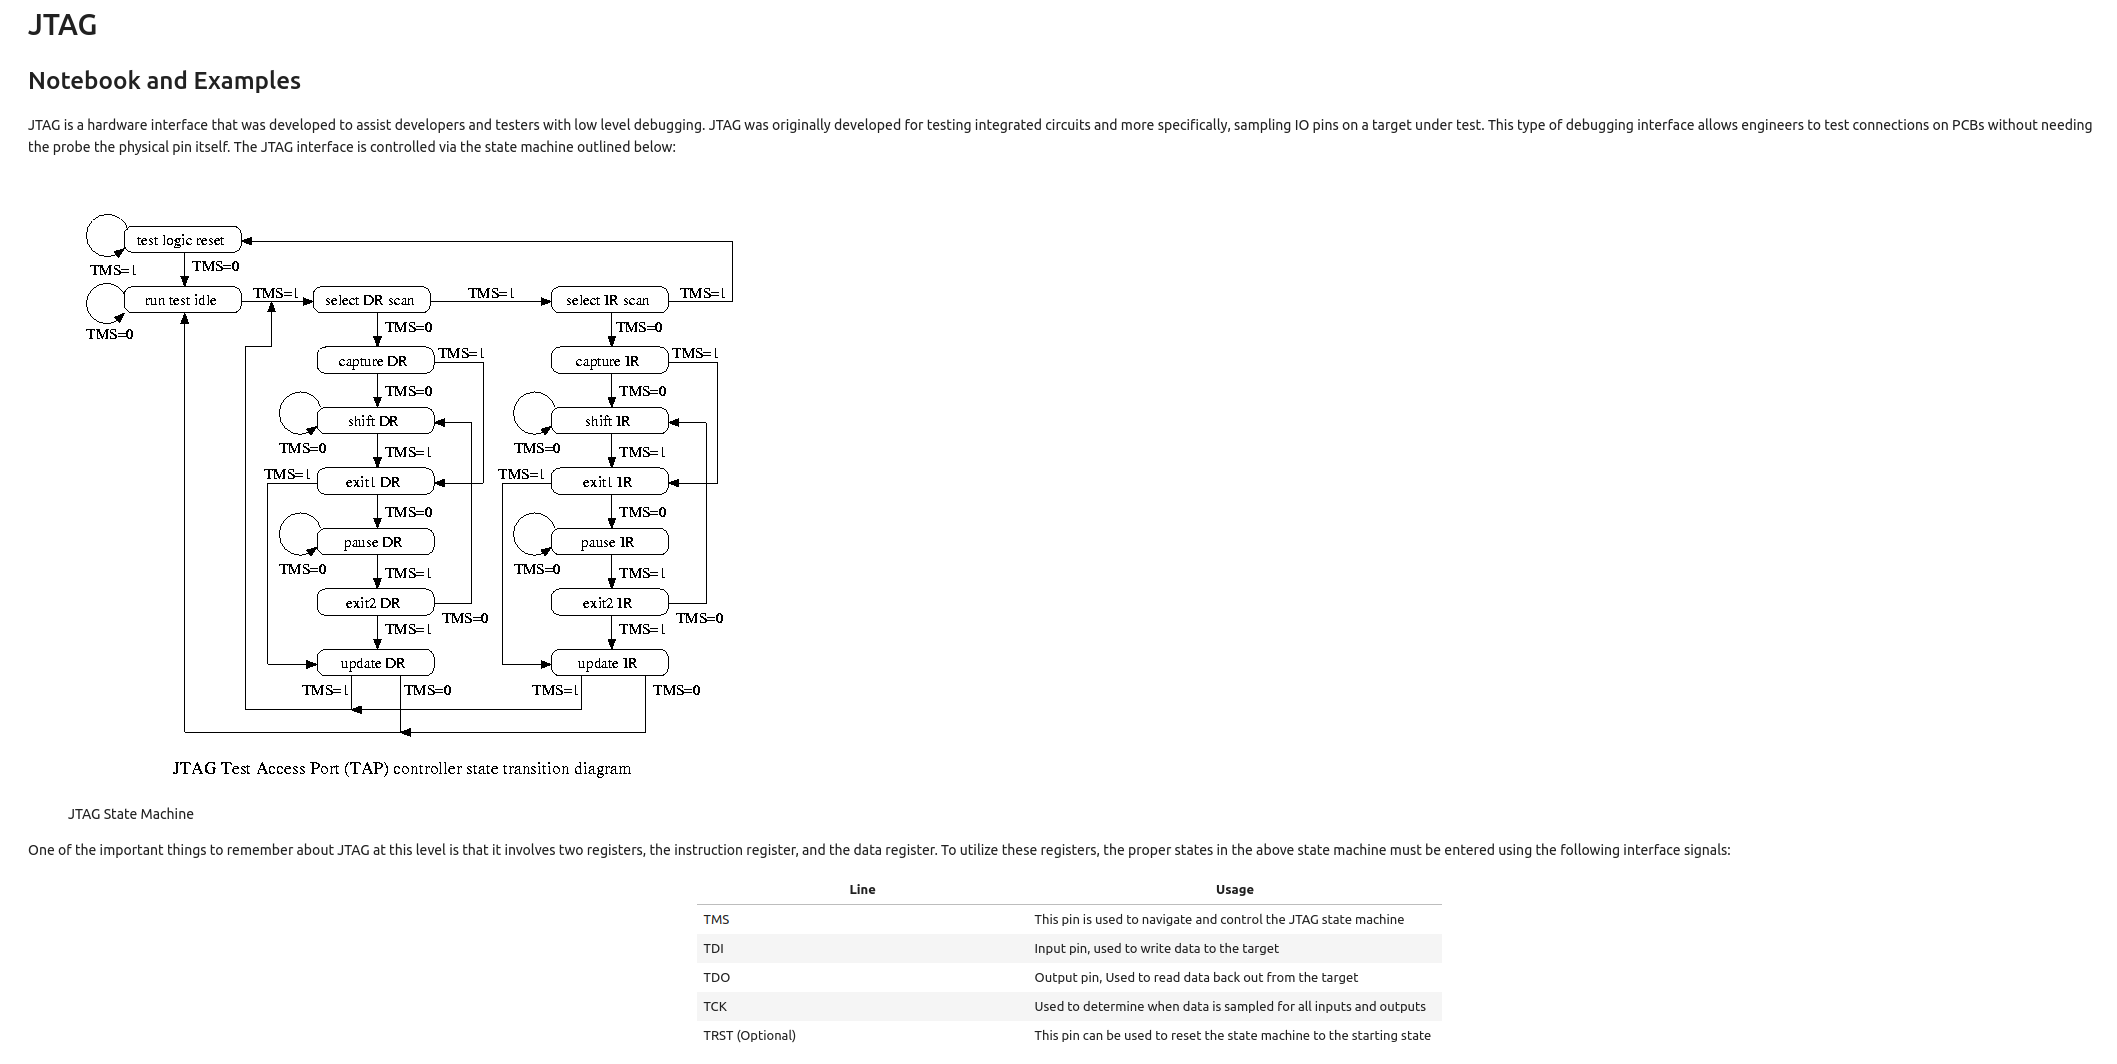
If you are unfamiliar with JTAG at a low level, you might want to read my previous blog post about reverse engineering JTAG taps.
PiFex: An Overview
The Pi Interface Explorer or PiFex, is a simple hat for a Raspberry Pi designed for tinkerers and hardware hackers alike. By breaking out the commonly used interfaces and routing them through bi-directional level shifters, we aimed to streamline some of the initial steps when reverse engineering a new device or trying to learn how a new sensor works. While this device was initially designed for use during our hardware hacking bootcamp it has quickly become my go-to when performing initial hardware assessments of COTS devices.
The PCB is well documented, and the IO pins are all labeled as shown in the image below:
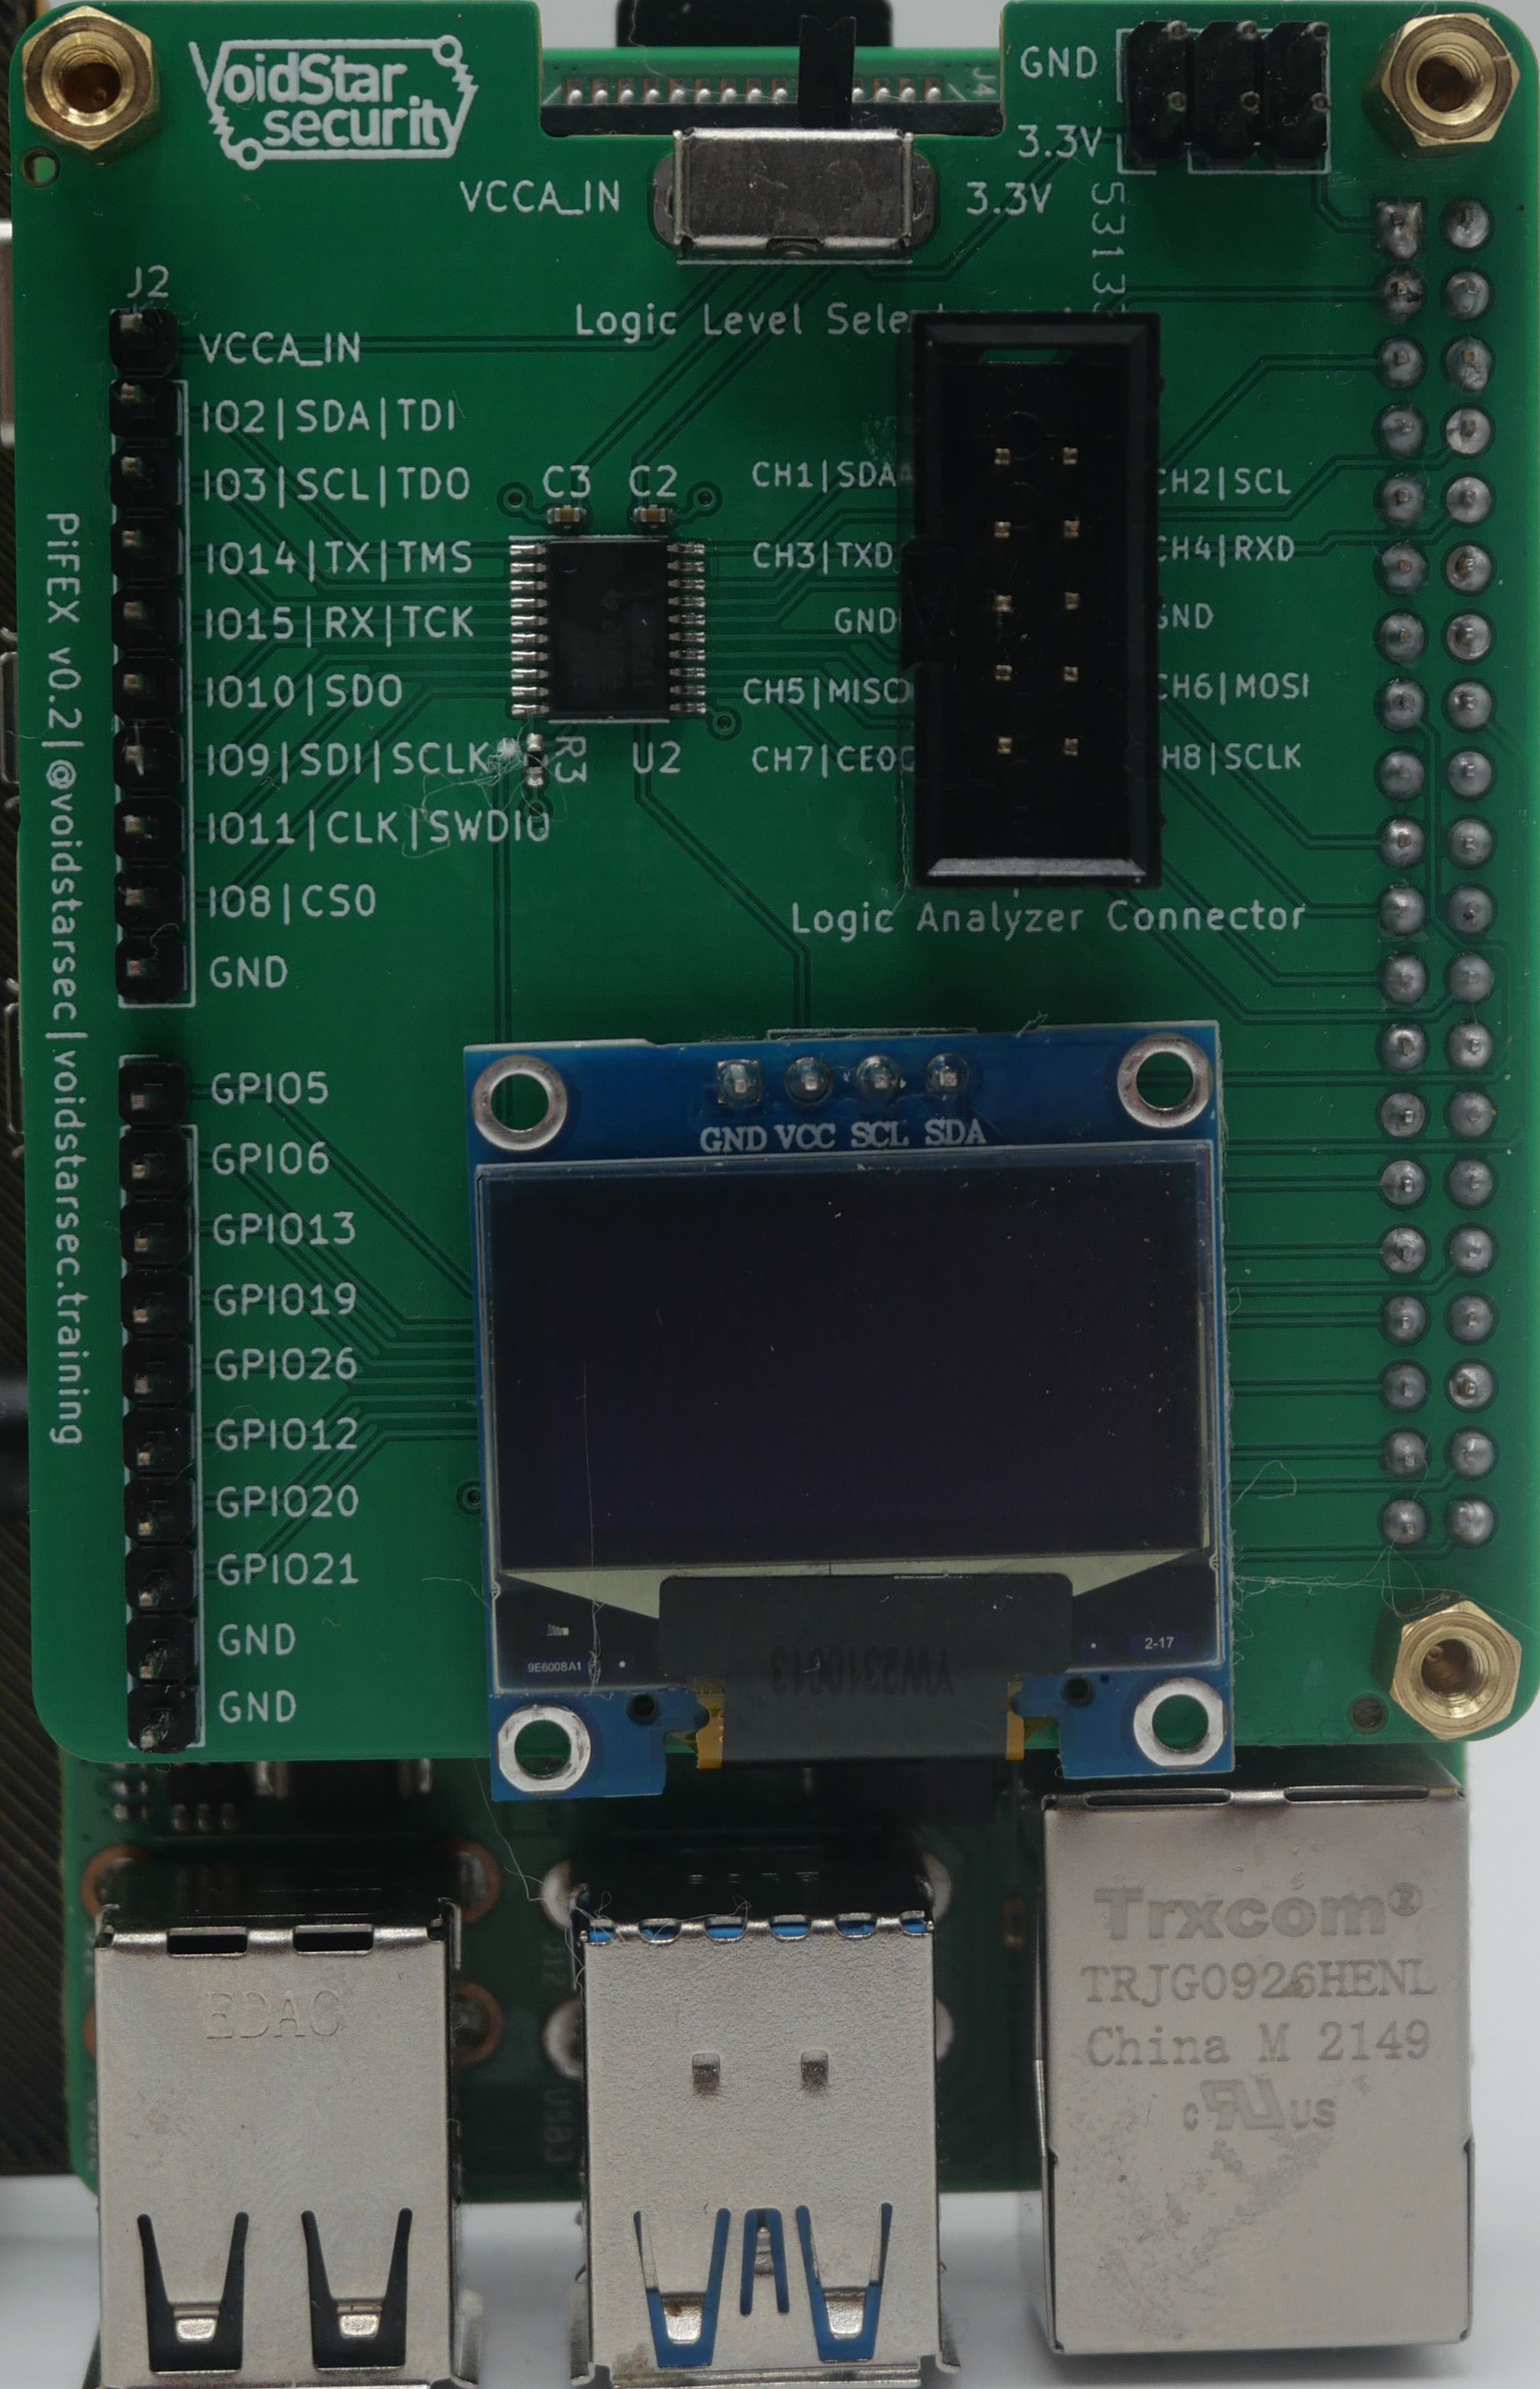
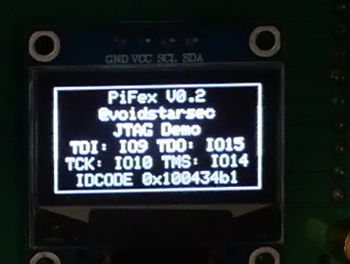
We also have added an I2C OLED screen, which you can customize using the Adafruit CircuitPython libraries:
PiFex: Hardware
The PiFex exposes the following interfaces to the end user:
- UART via
IO14andIO15 - SPI via
IO8,IO9,IO10andIO11 - I2C via
IO2andIO3 - JTAG via
IO2,IO3,IO14andIO15 - SWD via
IO9andIO11
There are also an additional eight GPIO pins. These interfaces were chosen because they are the ones that we utilize in our hardware hacking training and are also the most likely to be used by tinkerers and hardware hackers for other projects.
Logic Analyzer Connector
When reverse engineering a target device or inspecting why your custom code controlling a specific peripheral isn’t working, a logic analyzer is your best friend. To help simplify the wiring for both our training and standard usage, we also added a logic analyzer connector. This was done to remediate potential wiring issues and make debugging and troubleshooting as easy as possible. An interface board was designed to connect to entry-level logic analyzers that can be seen in the image below:
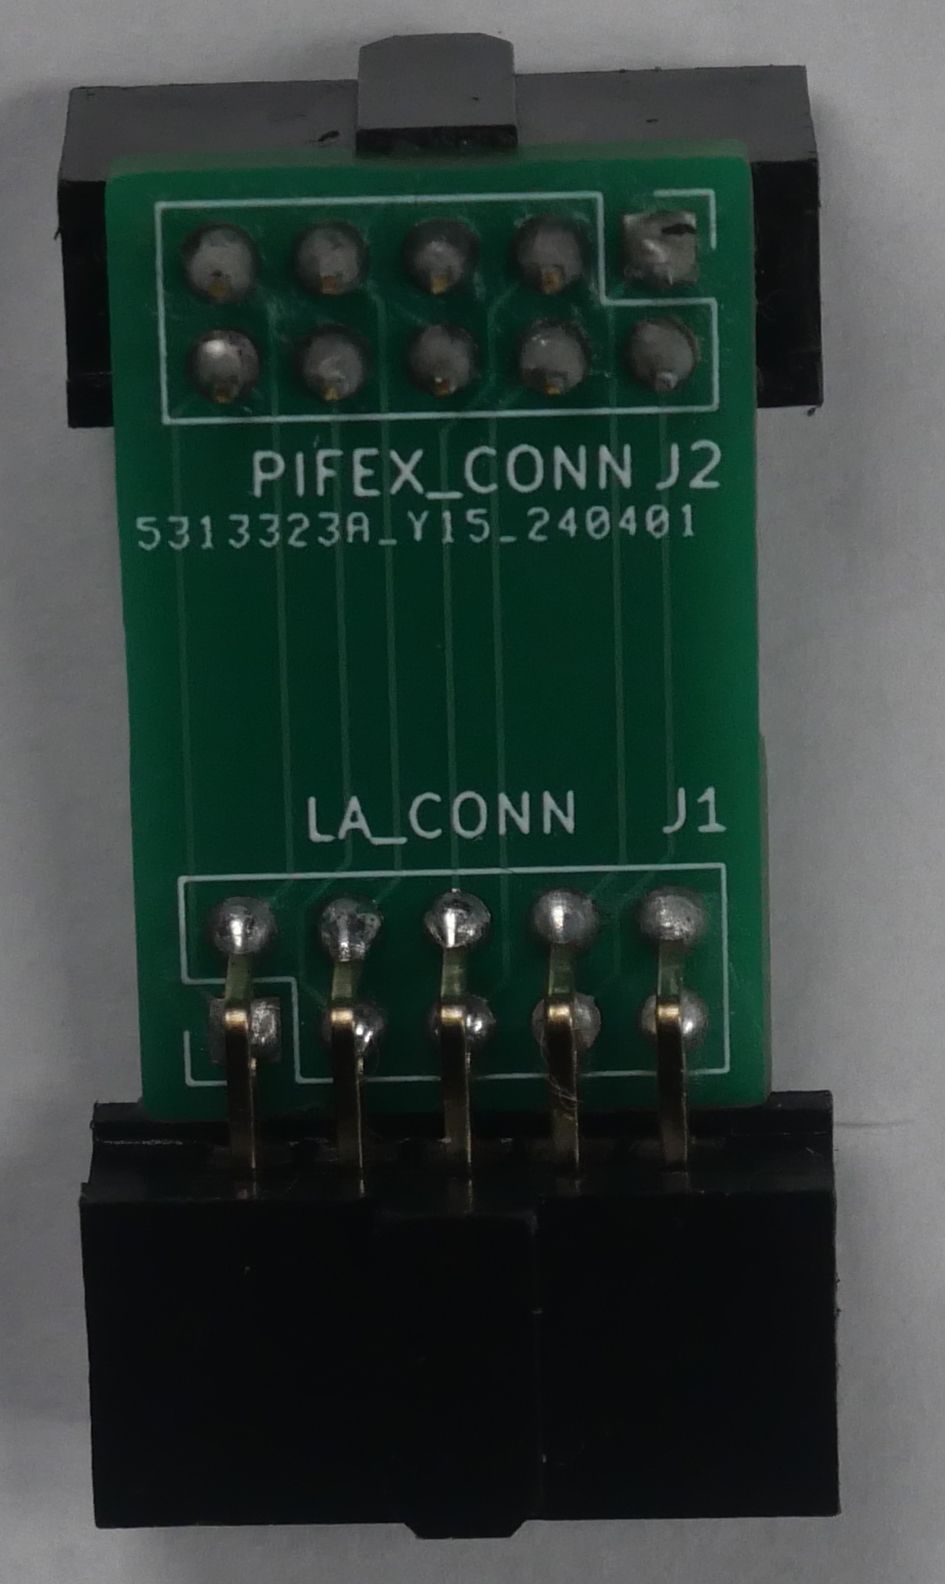
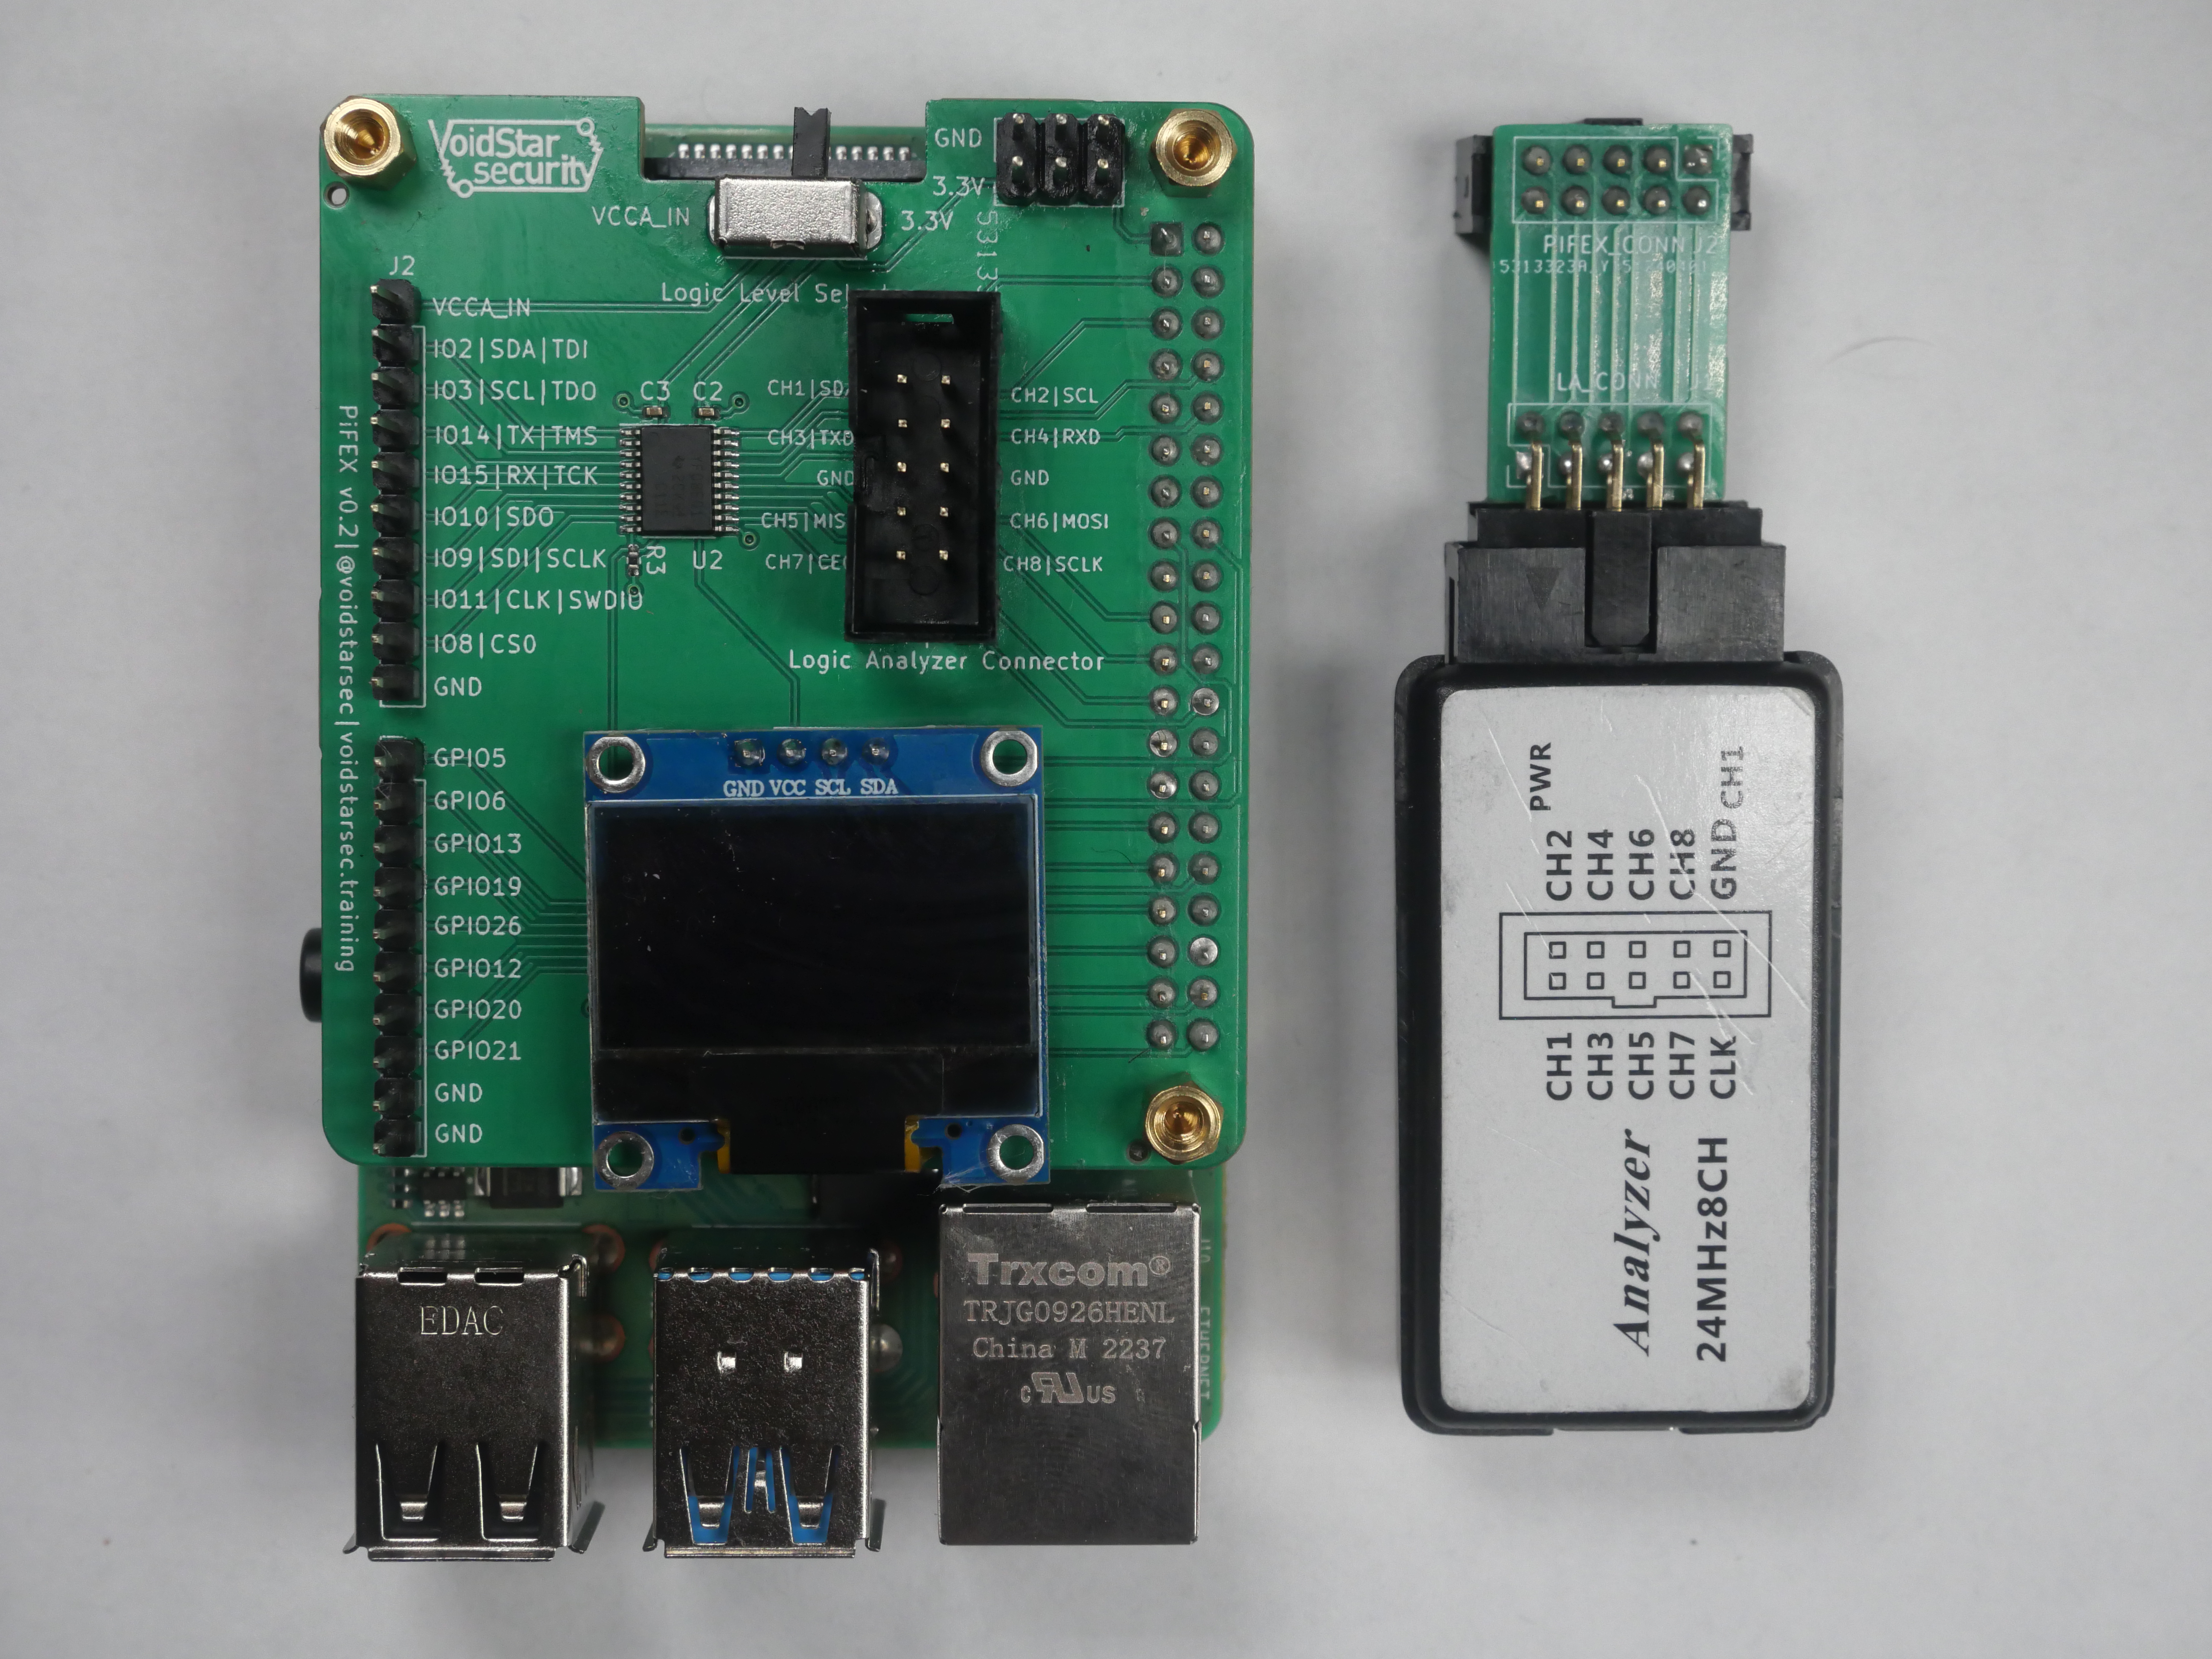
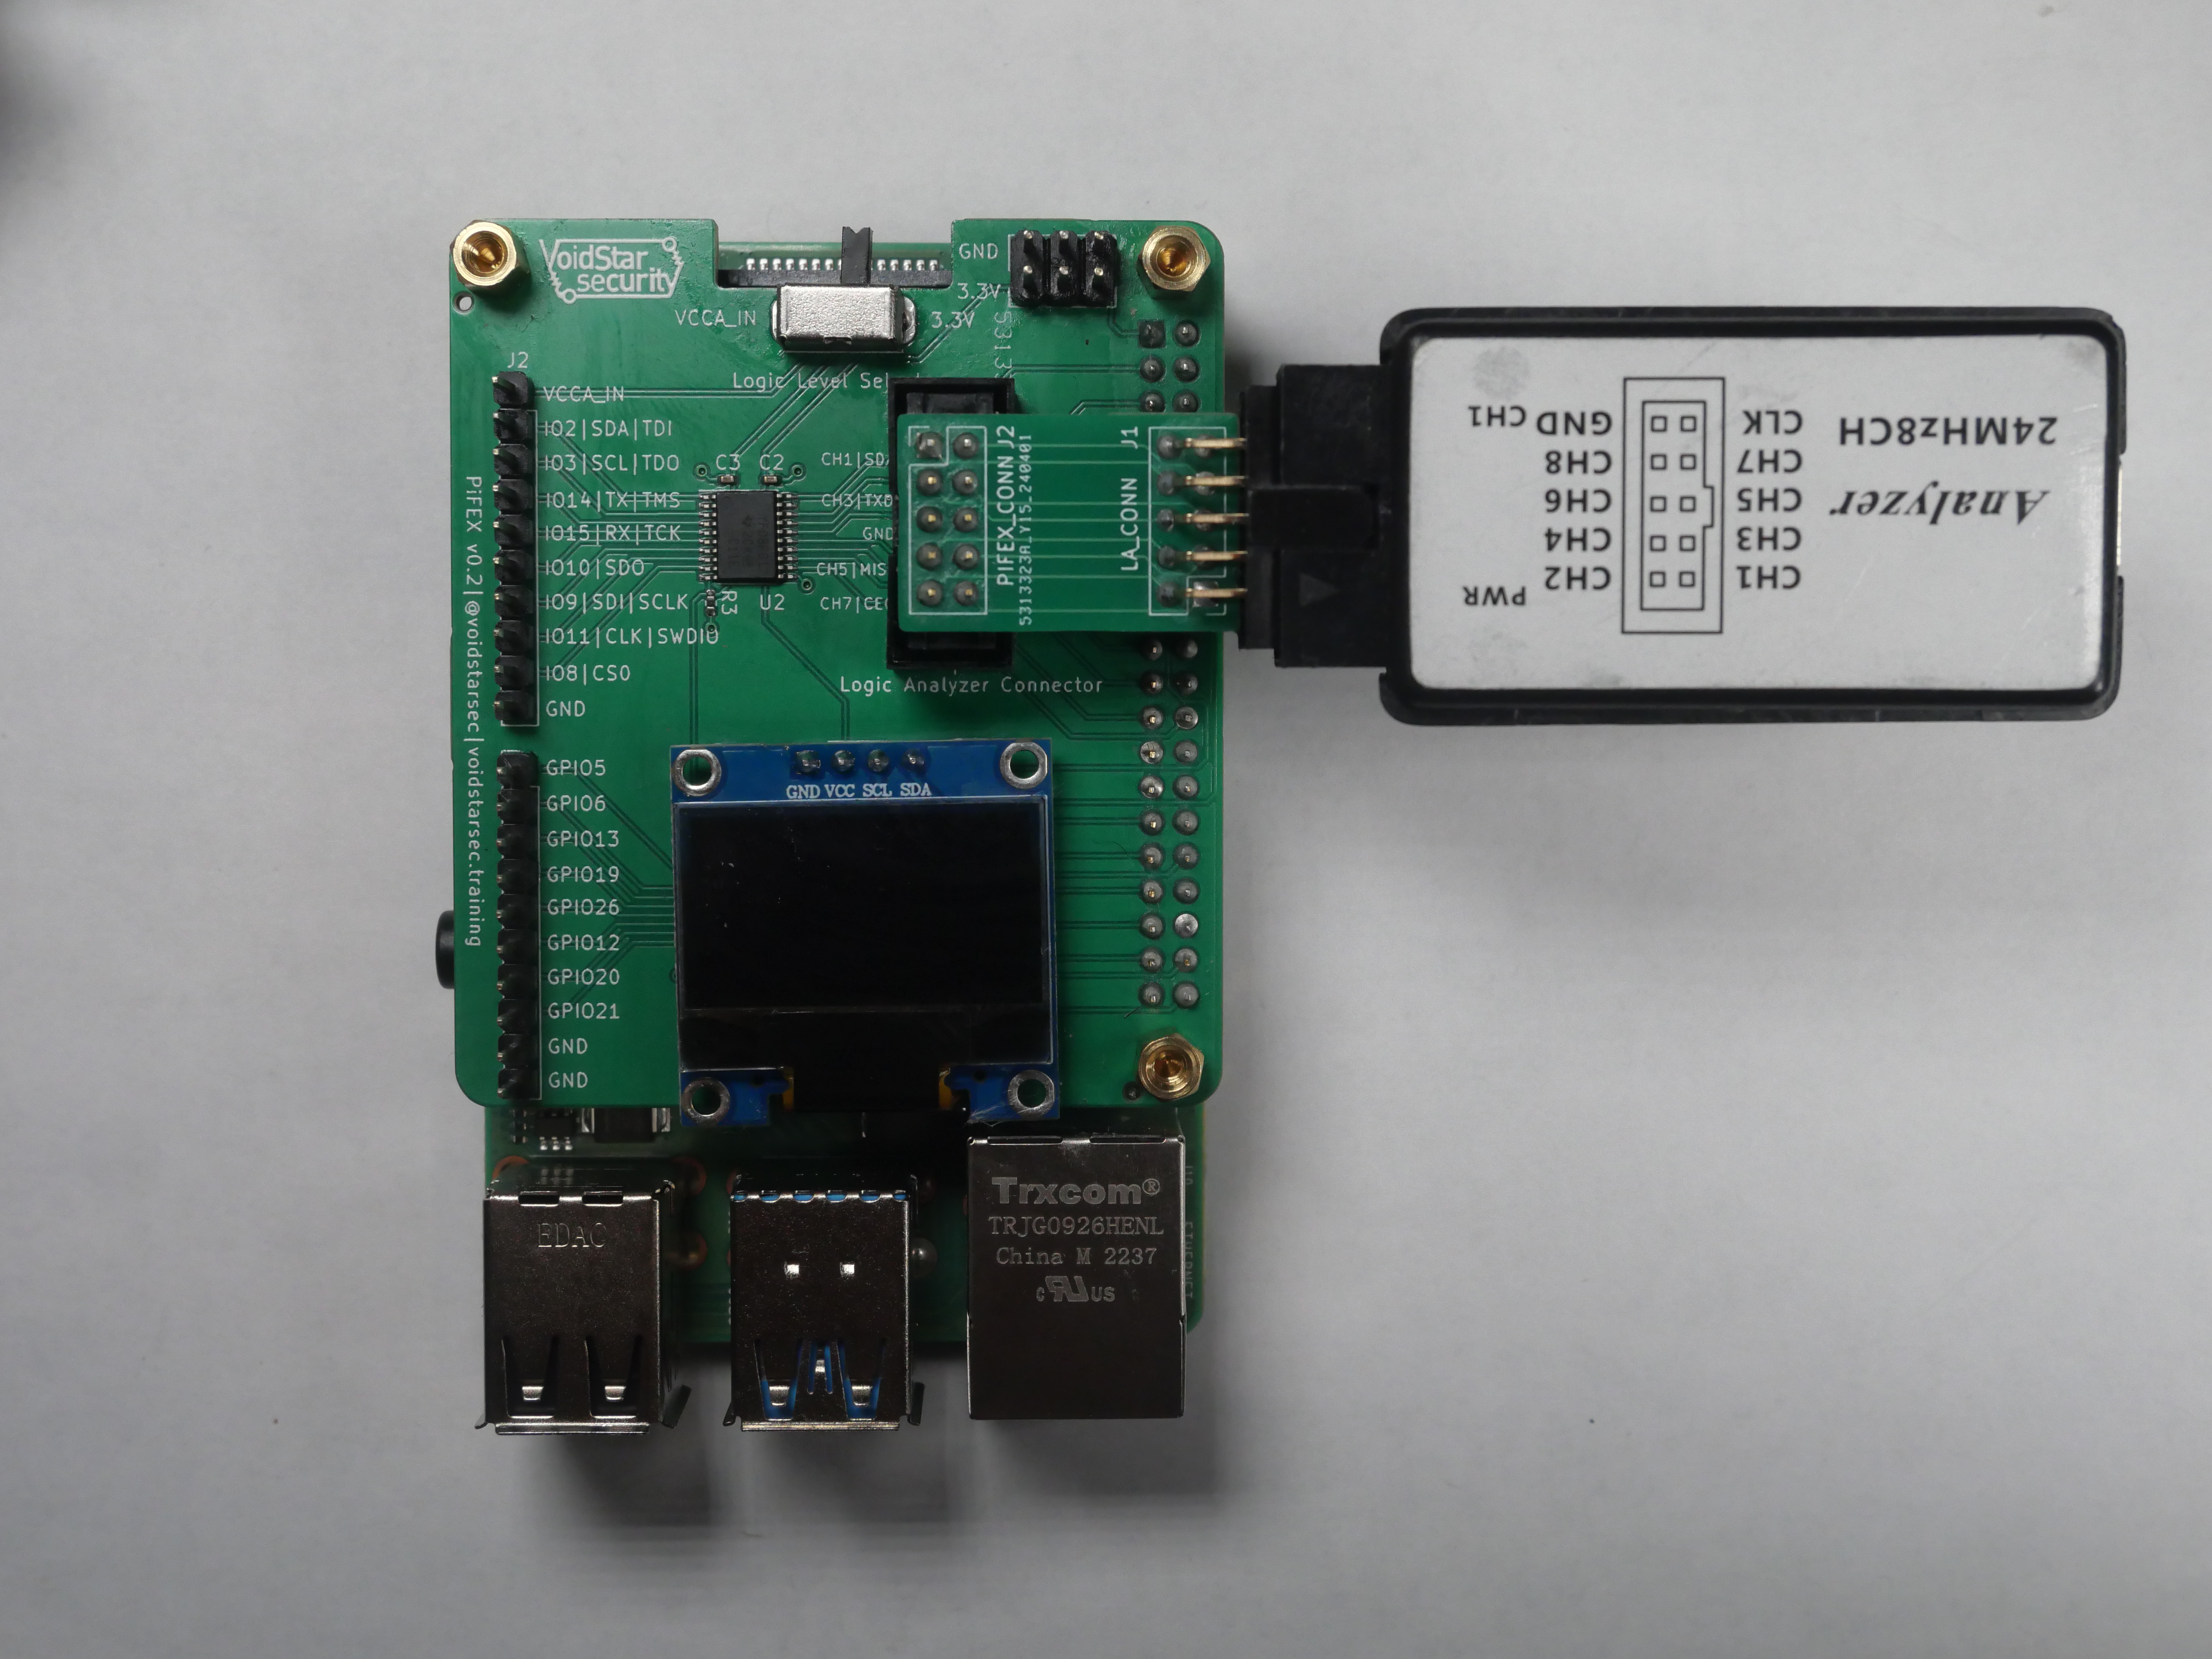
This helps streamline connecting a logic analyzer to the PiFex and analyzing the transmitted or monitored signals.
Level Shifter(s)
The Raspberry PI uses 3.3V logic levels, meaning it can only communicate with devices that use that same logic level. If we want to connect to a device that uses lower voltages (1.8V and 1.2V are becoming increasingly common), we need to route those through a level shifter. To streamline this and help reduce issues with wiring during our training, we’ve added two onboard level shifters.
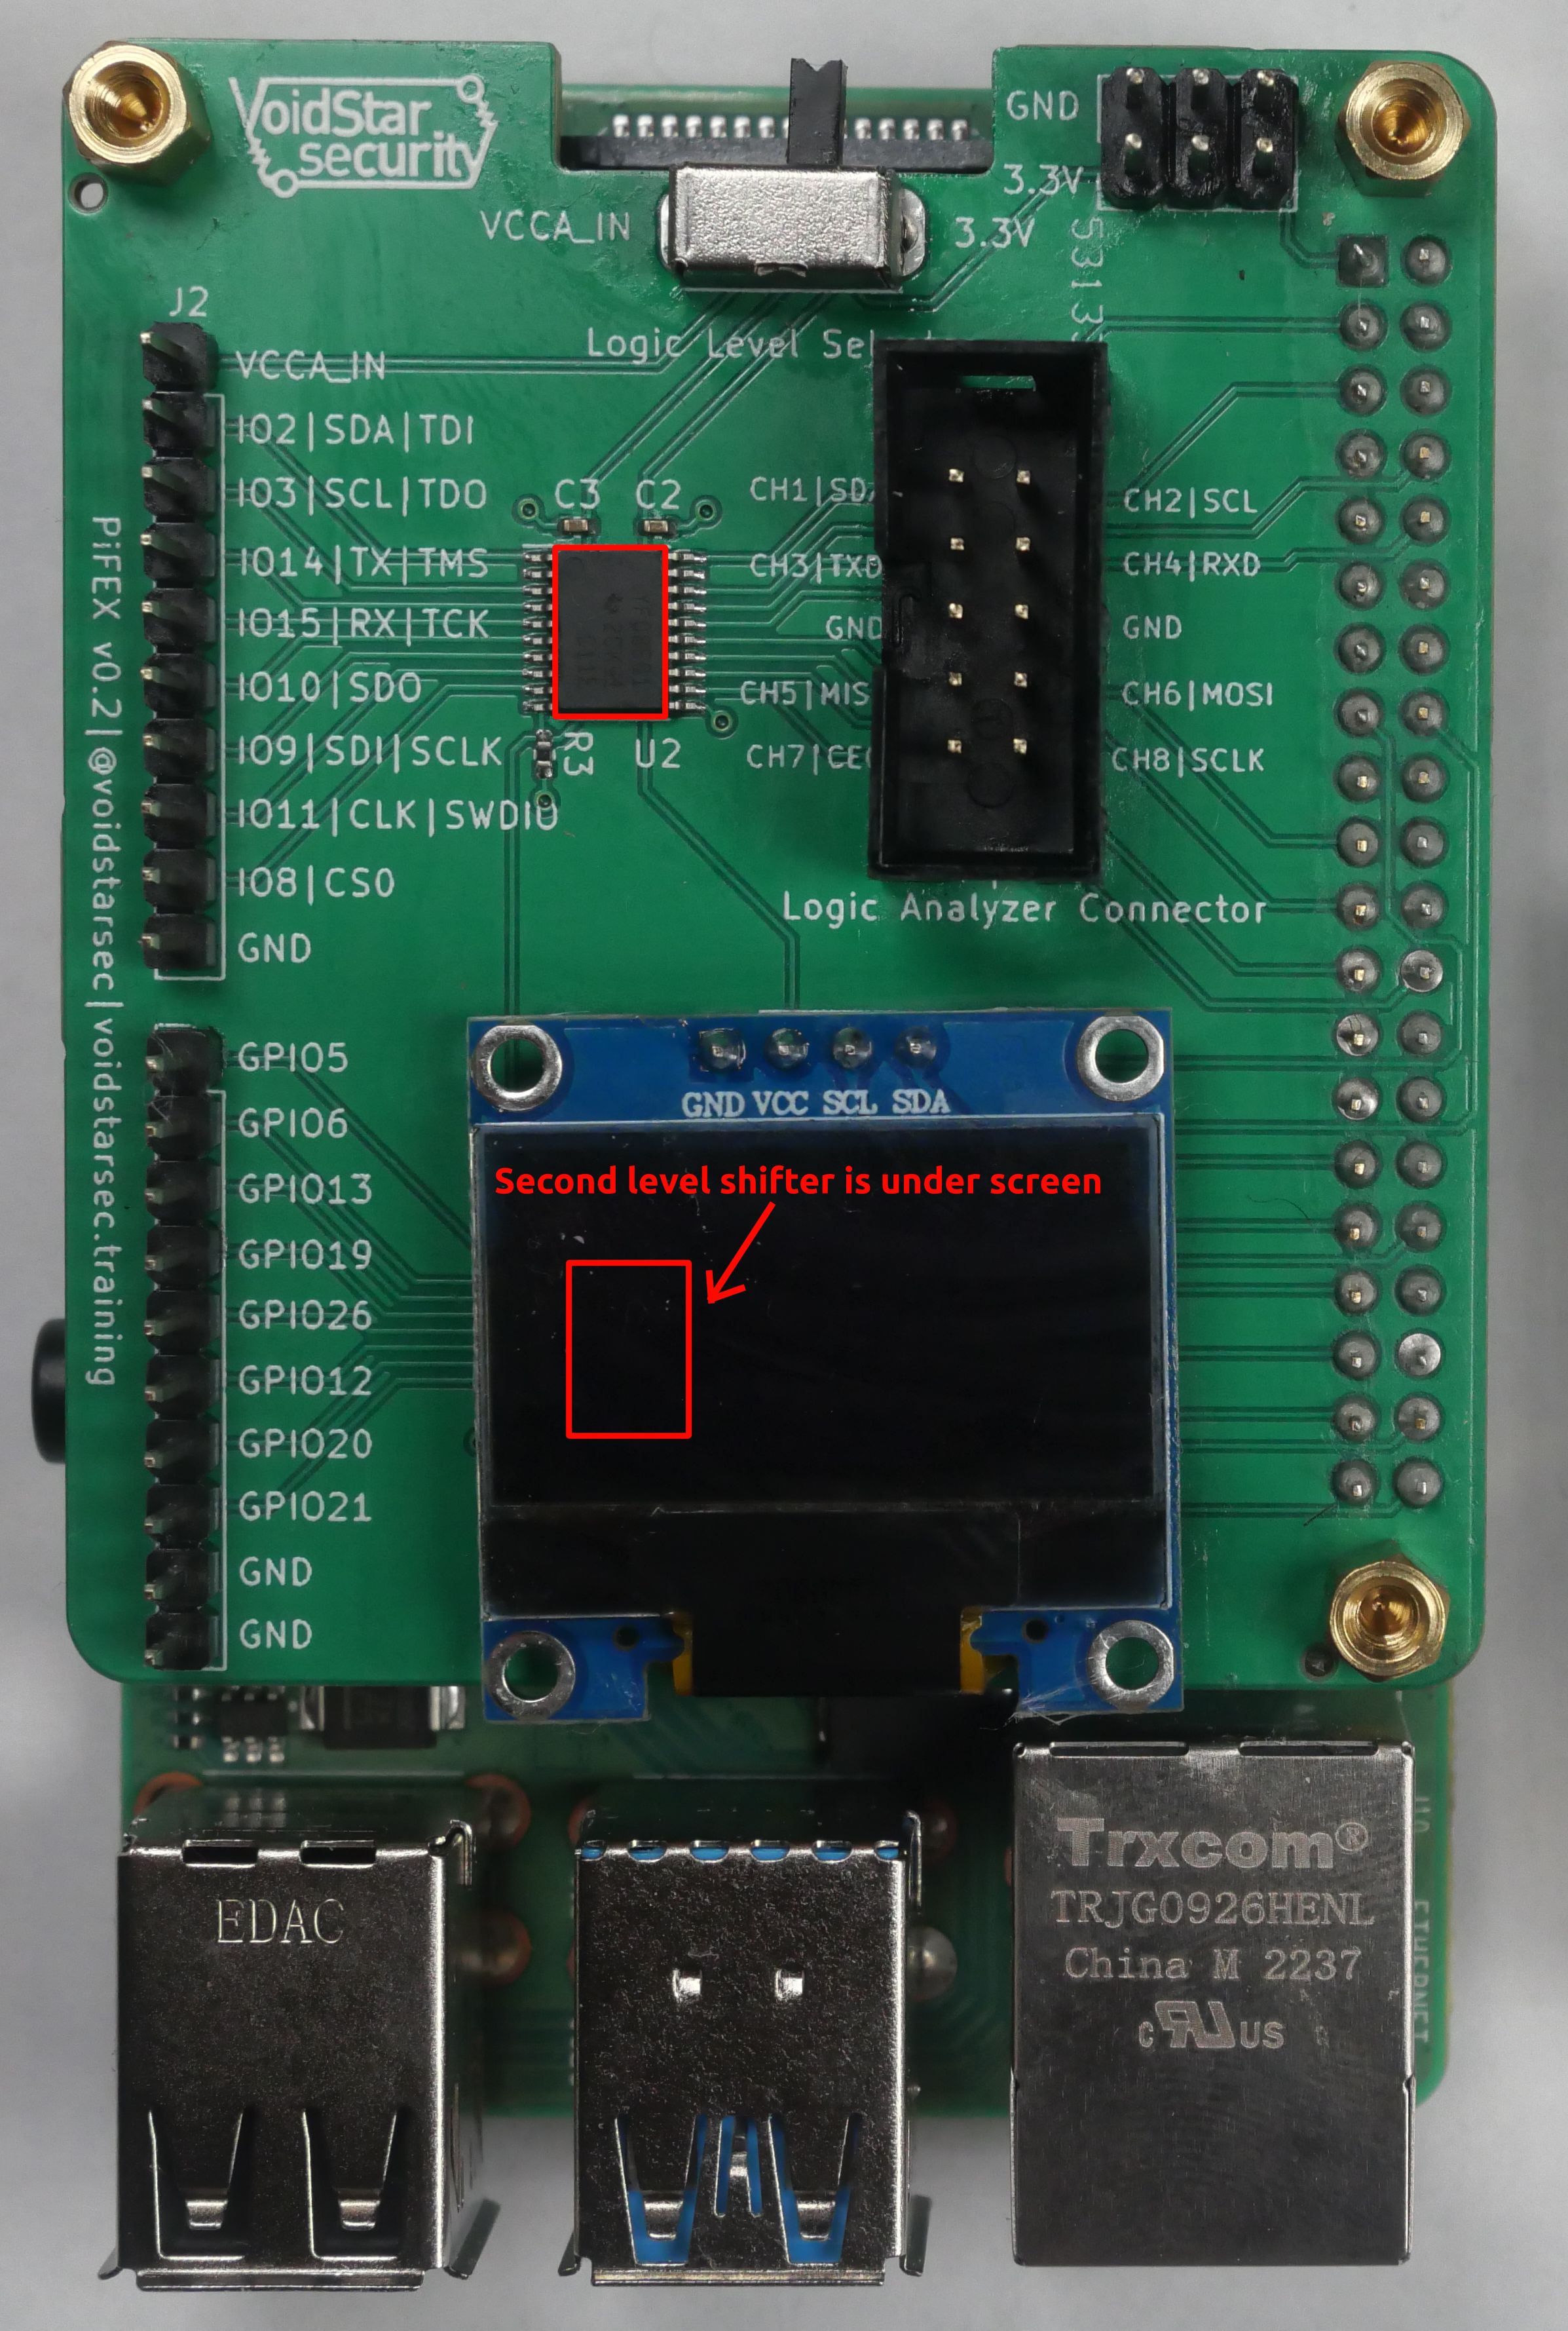
We chose to use the TXB0108 Bi-Directional level shifters; these allow us to communicate with devices at a voltage below 3.3V. In the case where a different logic level is needed, the user can select whether to use an external voltage source for the input voltage using the VCCA_IN line on the exposed headers. The level shifter then references this voltage by toggling the selector switch at the top of the board to VCCA_IN as opposed to the default state, which is 3.3V.
PiFex: Software
If you’ve ever had to set up a headless Raspberry Pi before, you know that it’s not always a simple task, and when performing remote training, we can’t assume that everyone will be able to manually configure their Pi to connect to their network. This is why we designed the PiFex image to use a USB-Ethernet gadget on startup to present an Ethernet device to the end user over USB. This results in an easy, predictable way to connect to the Pi. After plugging the Pi into their machine, all the user needs to do is set the IP address, and they are all set. A short video walking through the web interface can be seen below:
As mentioned in the previous section, one of the initial hurdles when learning about embedded protocols is selecting what tool or interface you want to learn with. Embedded development boards like the Arduino series or STM32 series are great but require setting up a development environment and understanding the specifics of the target microcontroller. One of the benefits of using an embedded Linux board is that these interfaces are exposed via /dev/ and can be accessed using many programming languages such as Python, Rust, C, and even bash.
Jupyter Notebooks
Throughout our training, we utilize Jupyter Notebooks to help streamline the process and provide students with template notebooks for future assessments. For example, the JTAG notebook contains instructions and tooling to perform:
-
JTAG Scan Chain Detection via
go-jtagenum -
Example UrJTAG Python Bindings for low-level scan chain access
-
Example OpenOCD configurations and Python bindings for scripting JTAG operations
Screenshots of the included notebooks can be seen below:
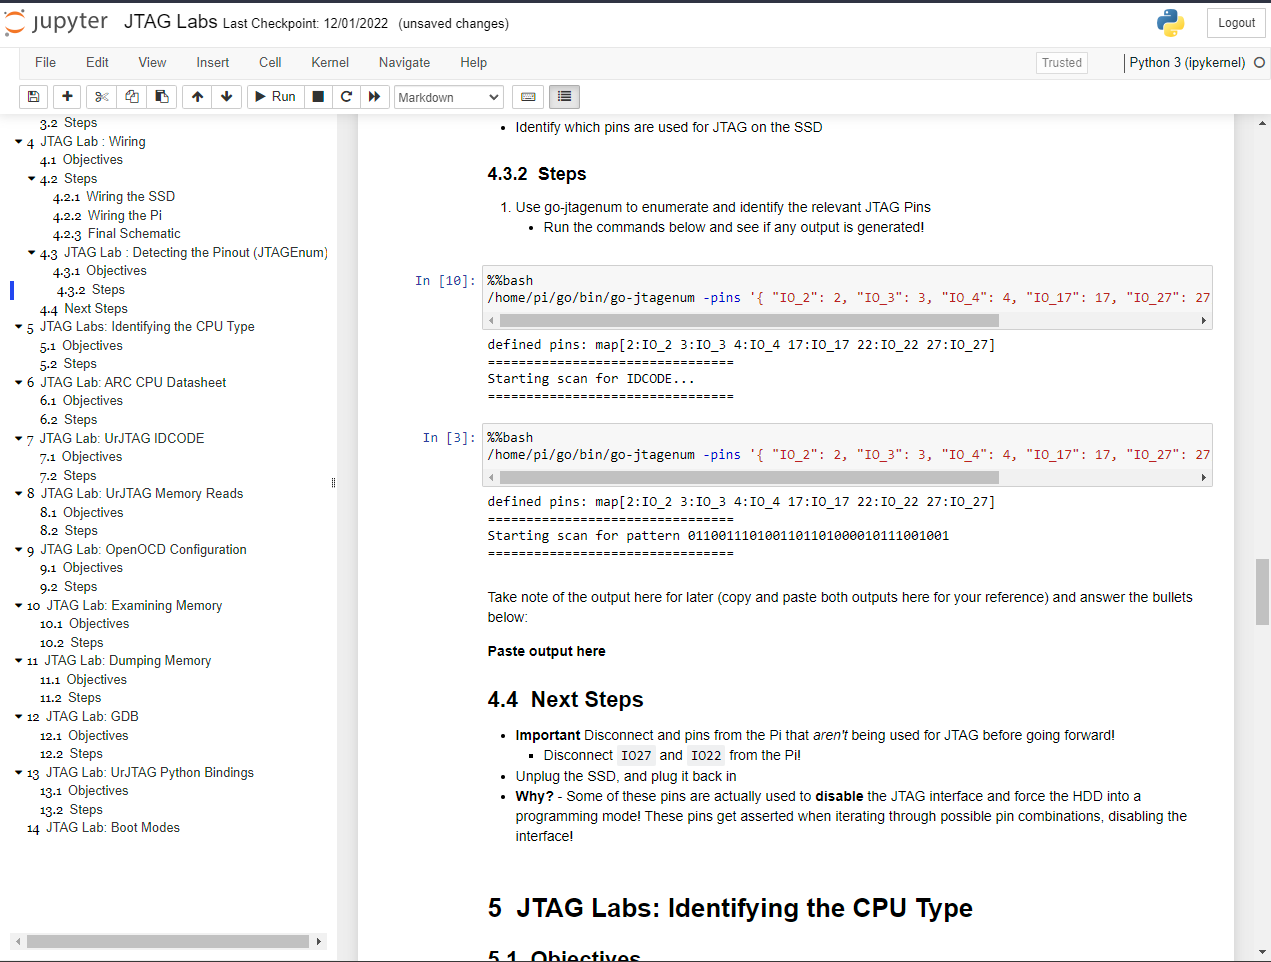
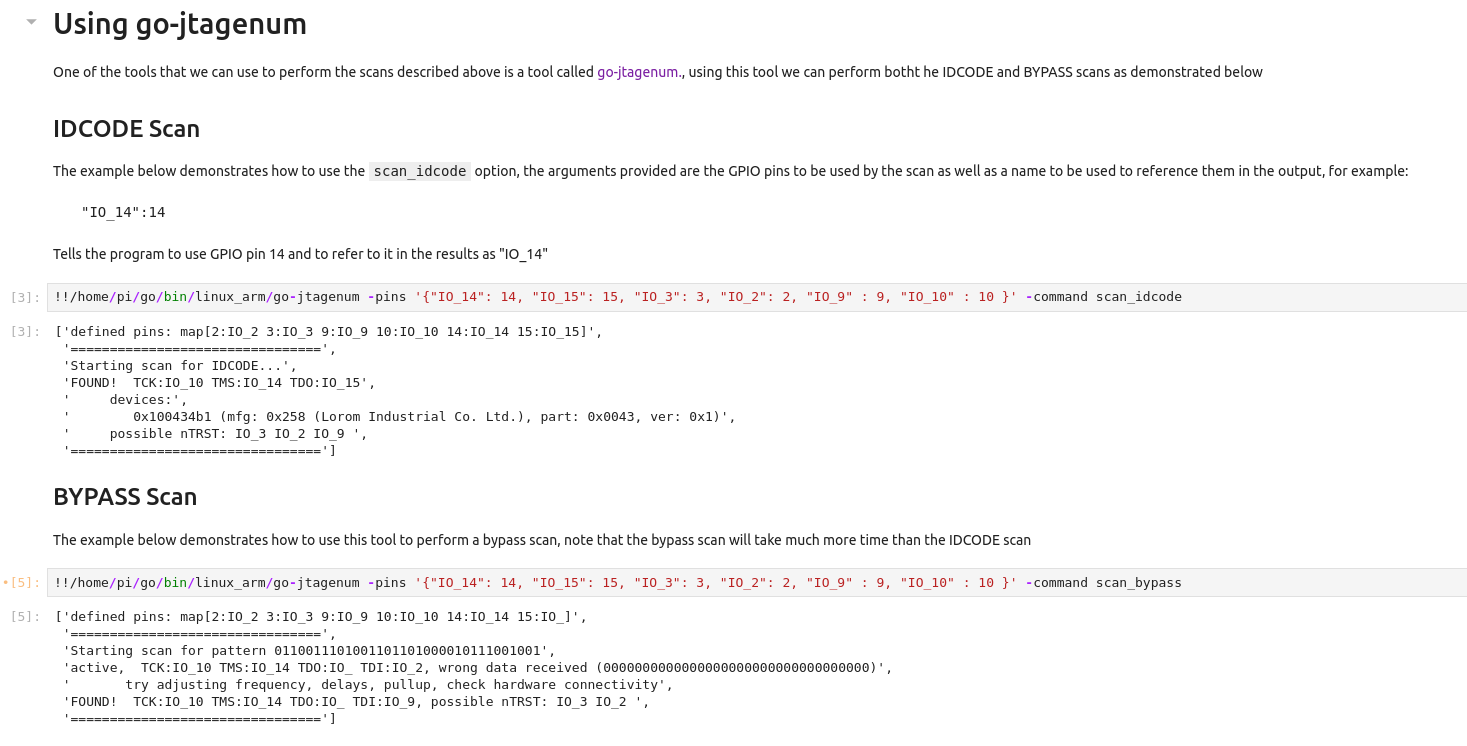
While in class, we will use all of these features on our target, and students will be able to copy this notebook and use the same tools and techniques for future targets.
Last but certainly not least, we’ve configured the PiFex image to allow access to standard tools such as SSH and FTP. Now that we’ve reviewed the PiFex’s features and intended use case, let’s reverse-engineer the JTAG TAP for an undocumented target!
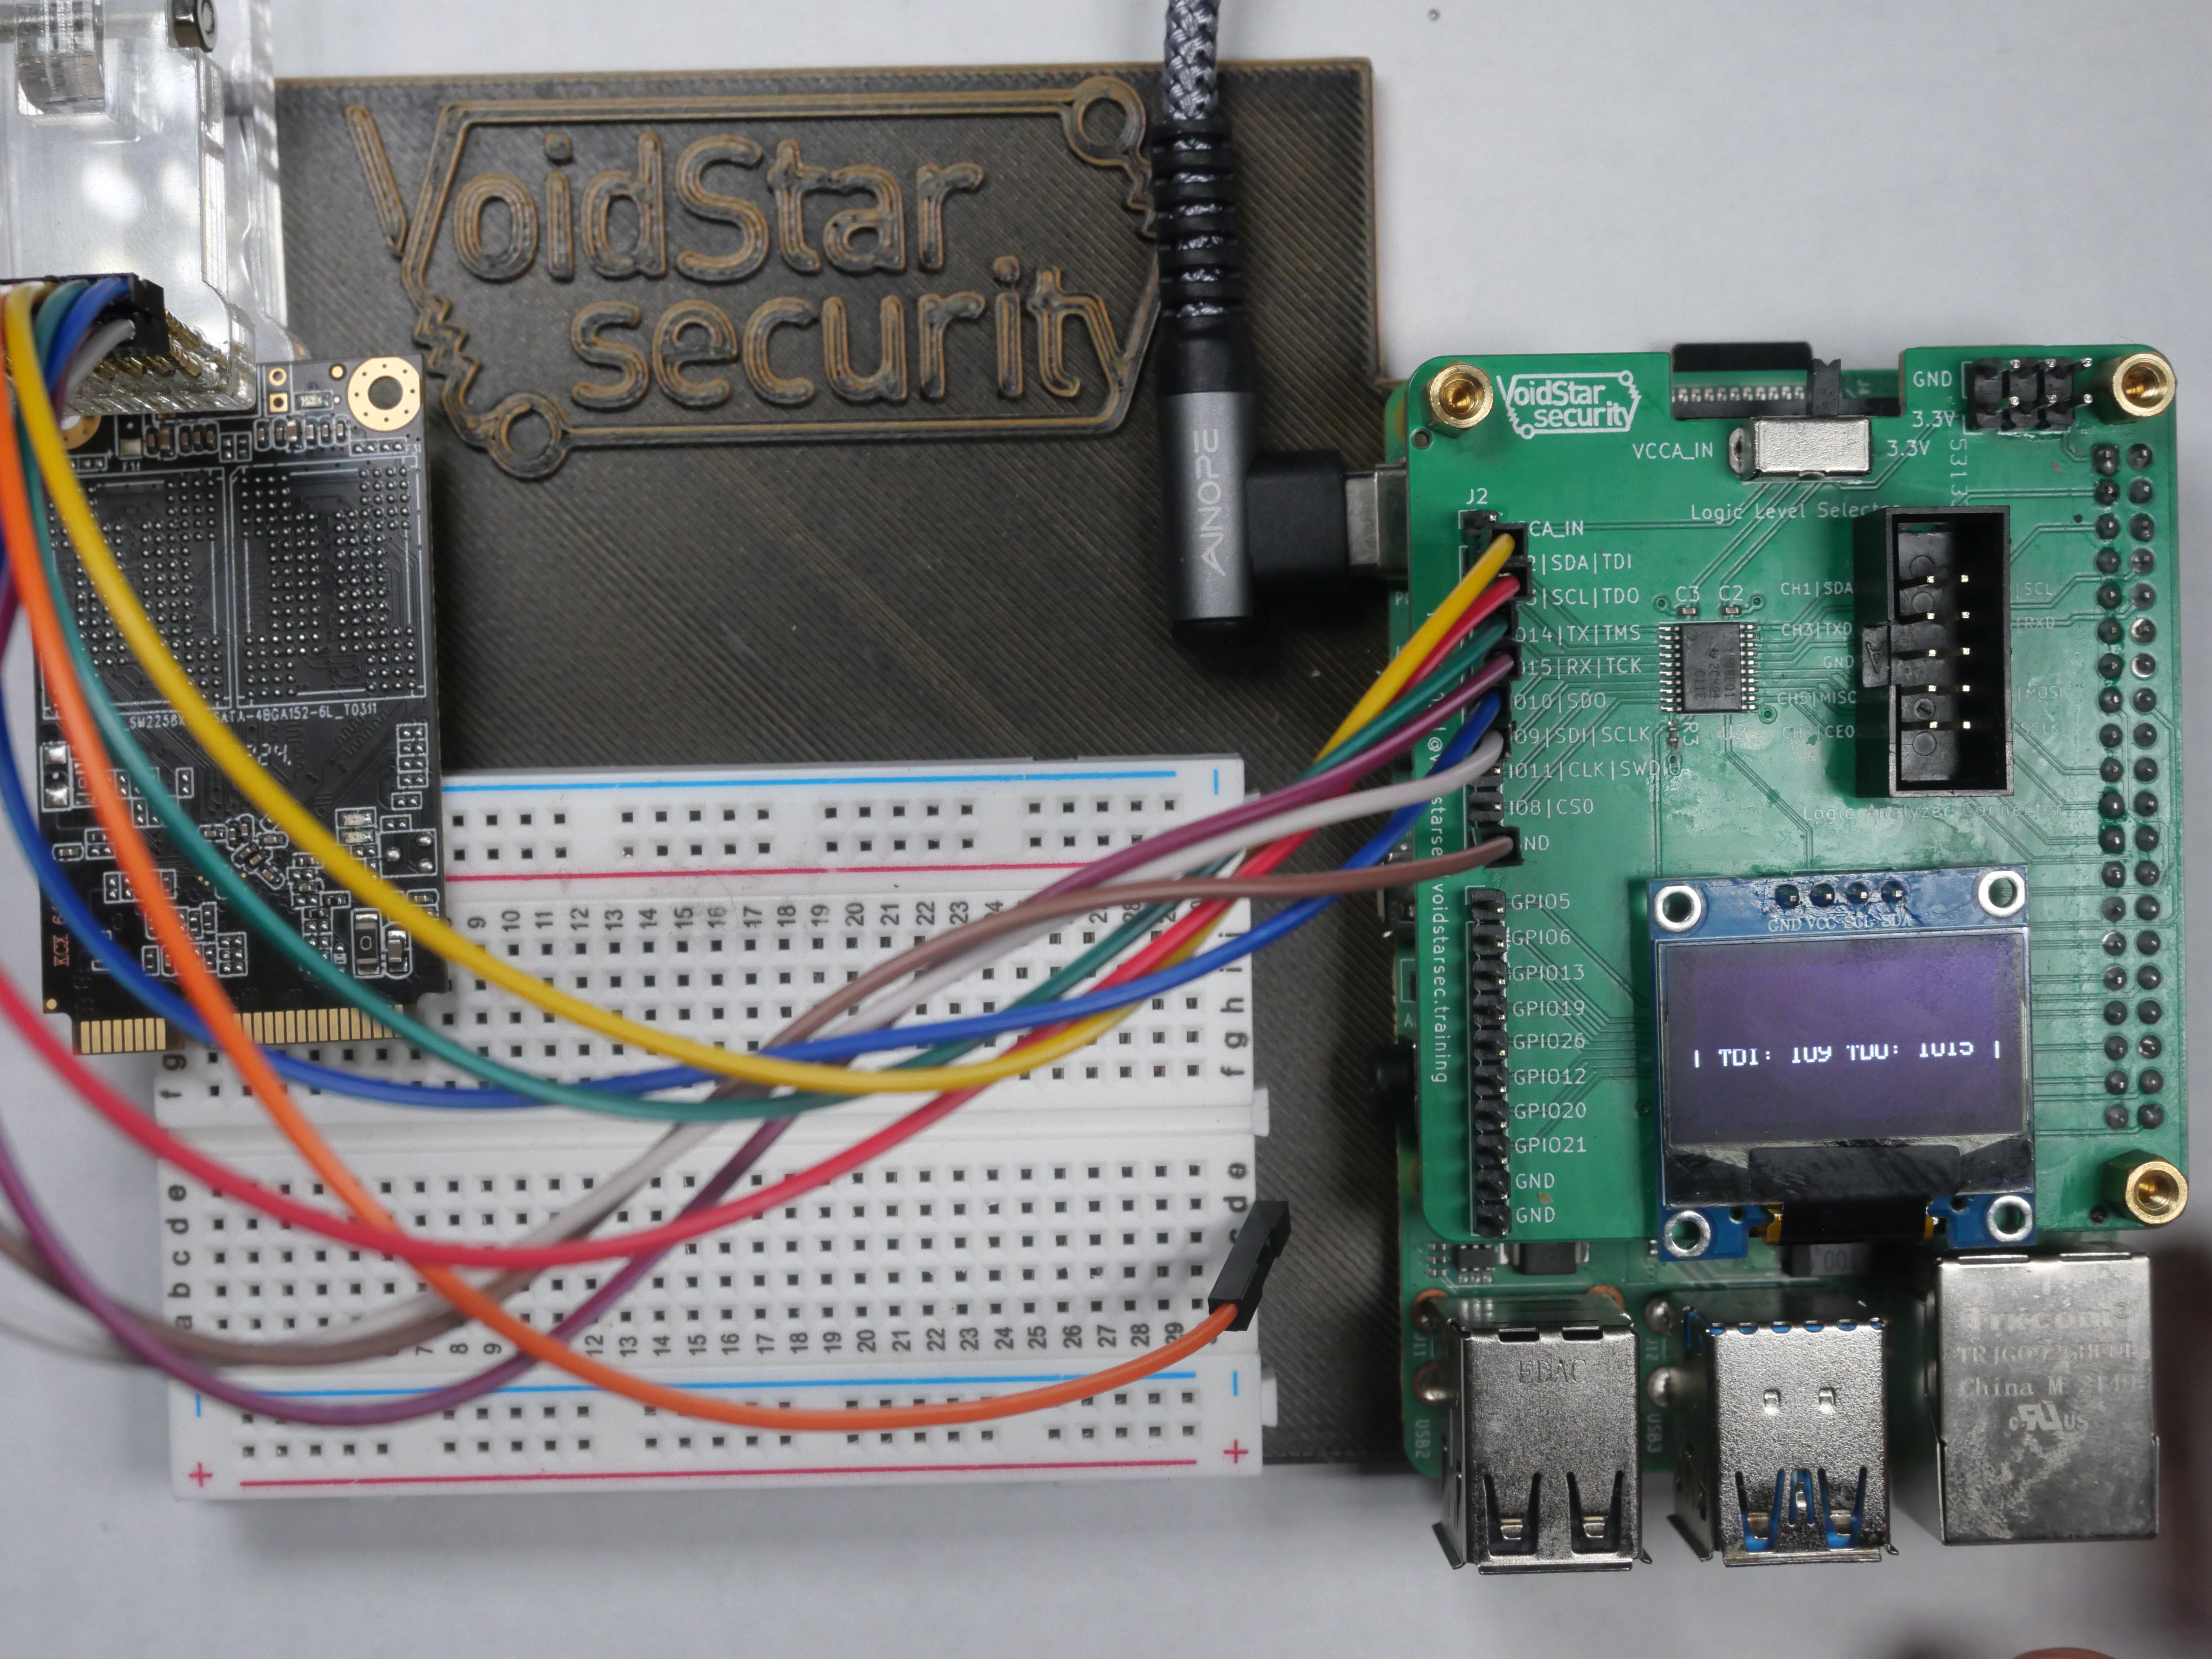
PiFex Demo 1 : JTAG
So, we’ve talked about our new hardware tooling. How about a demonstration of it in action? Let’s start with a low-cost SSD purchased on AliExpress.
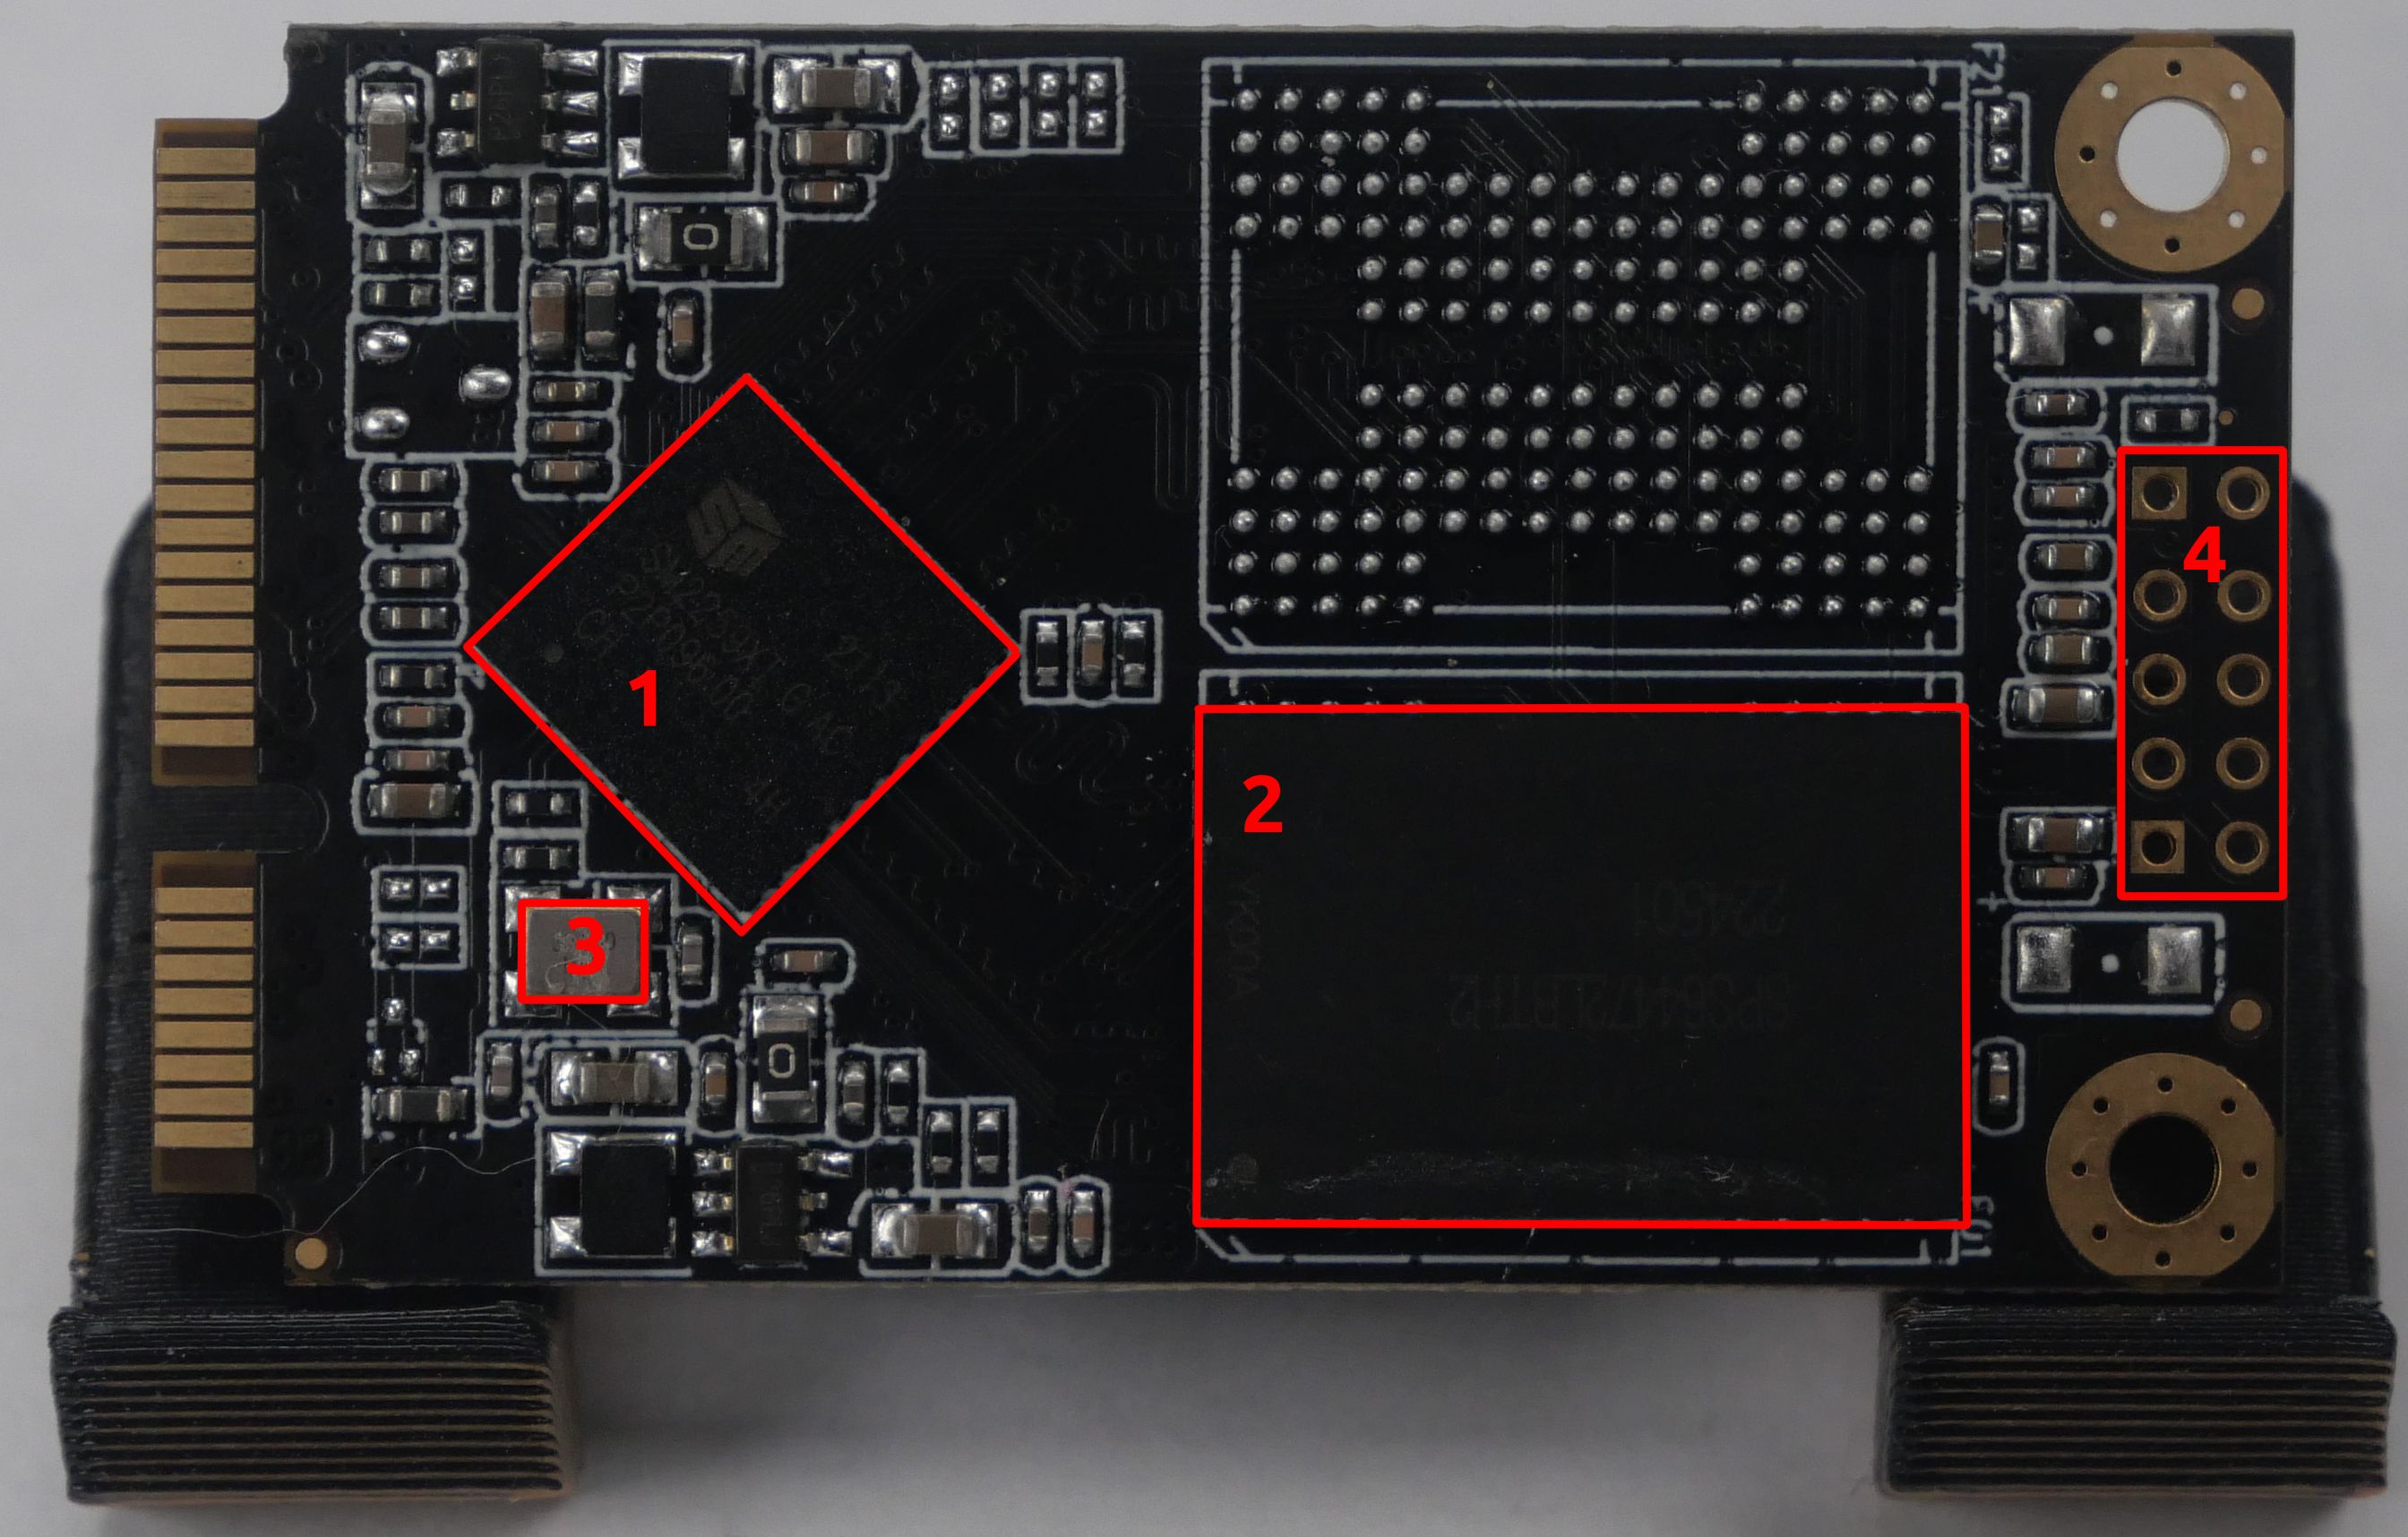
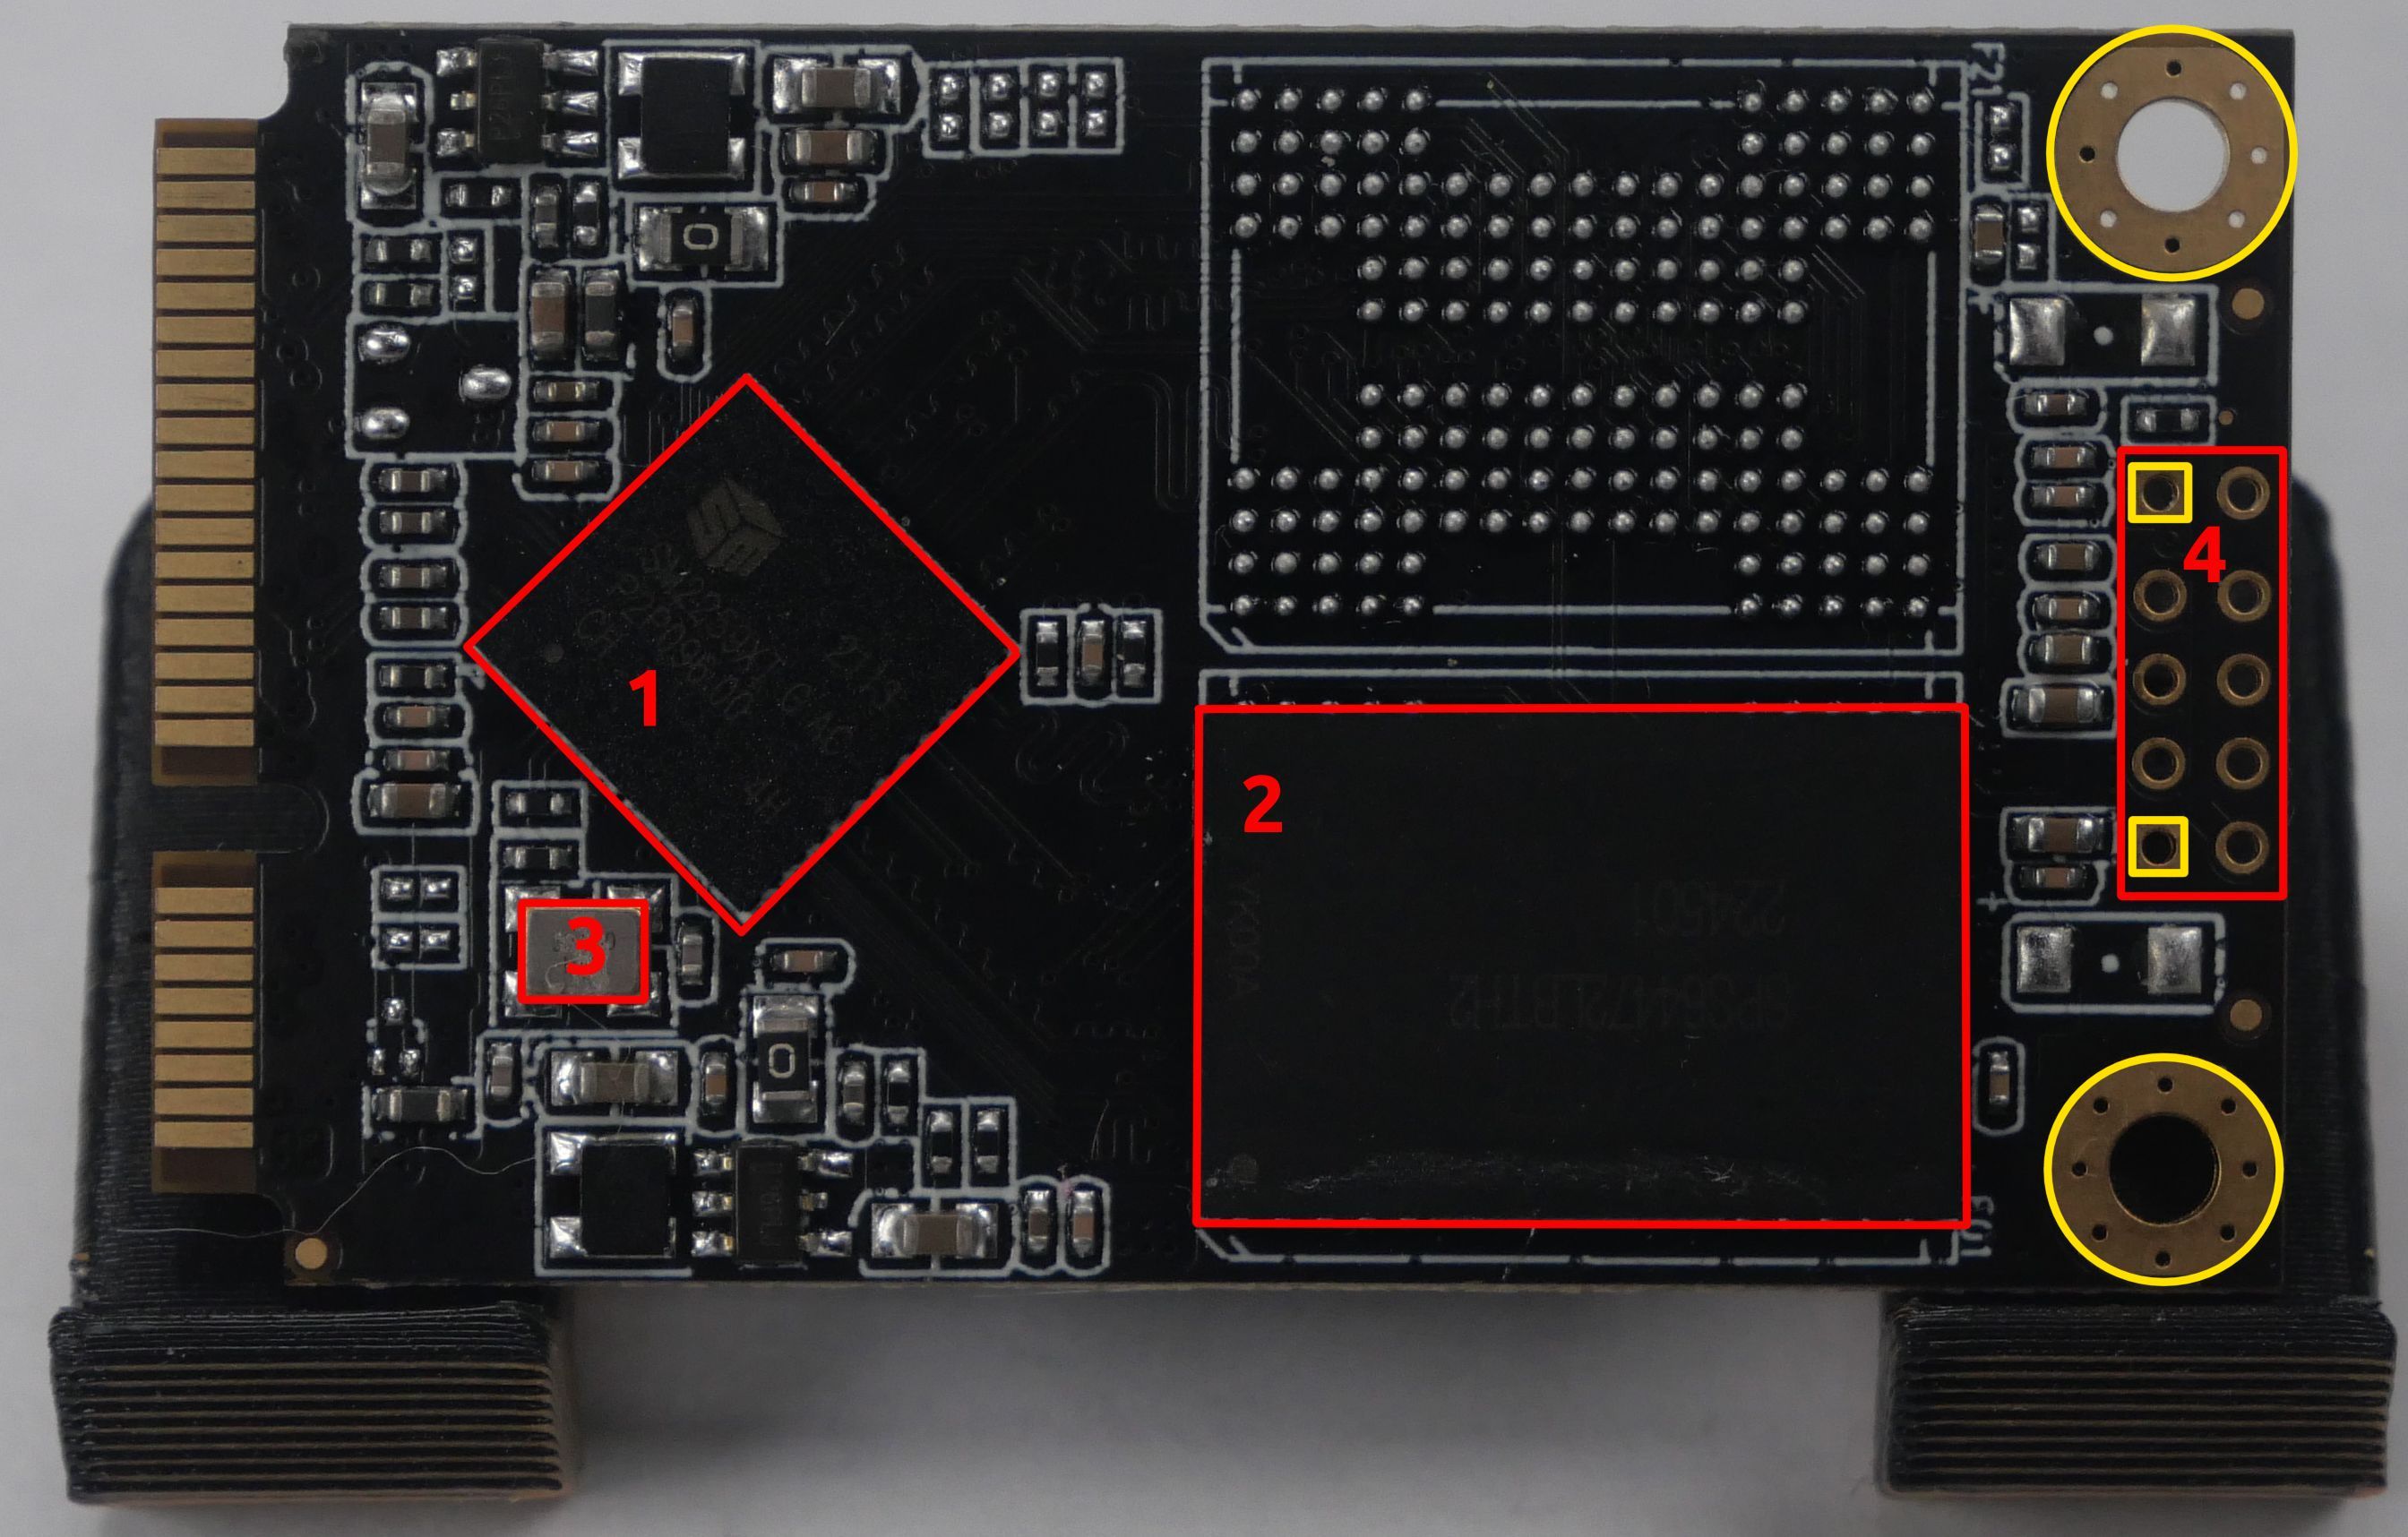
If we break down the hardware, we have the following:
| Component | Part Number | Datasheet / Information |
|---|---|---|
| 1 | SM2259XT | Advertisement / Basic Information |
| 2 | SPS64472LBTH2 | NA - 64GB NAND Flash |
| 3 | 50.00 MHz | Oscilator |
| 4 | NA | 10 pin debug header |
After searching for datasheets, we were not able to locate much; however, next, we will investigate the mystery header at the end of the board. Let’s start by looking at this debug connector at the end of the drive. First, we will attempt to identify the ground connection. To do this, we will use our multimeter in continuity mode and test against a known ground. We will use the large copper fills to connect the SSD to an adapter board in this case.
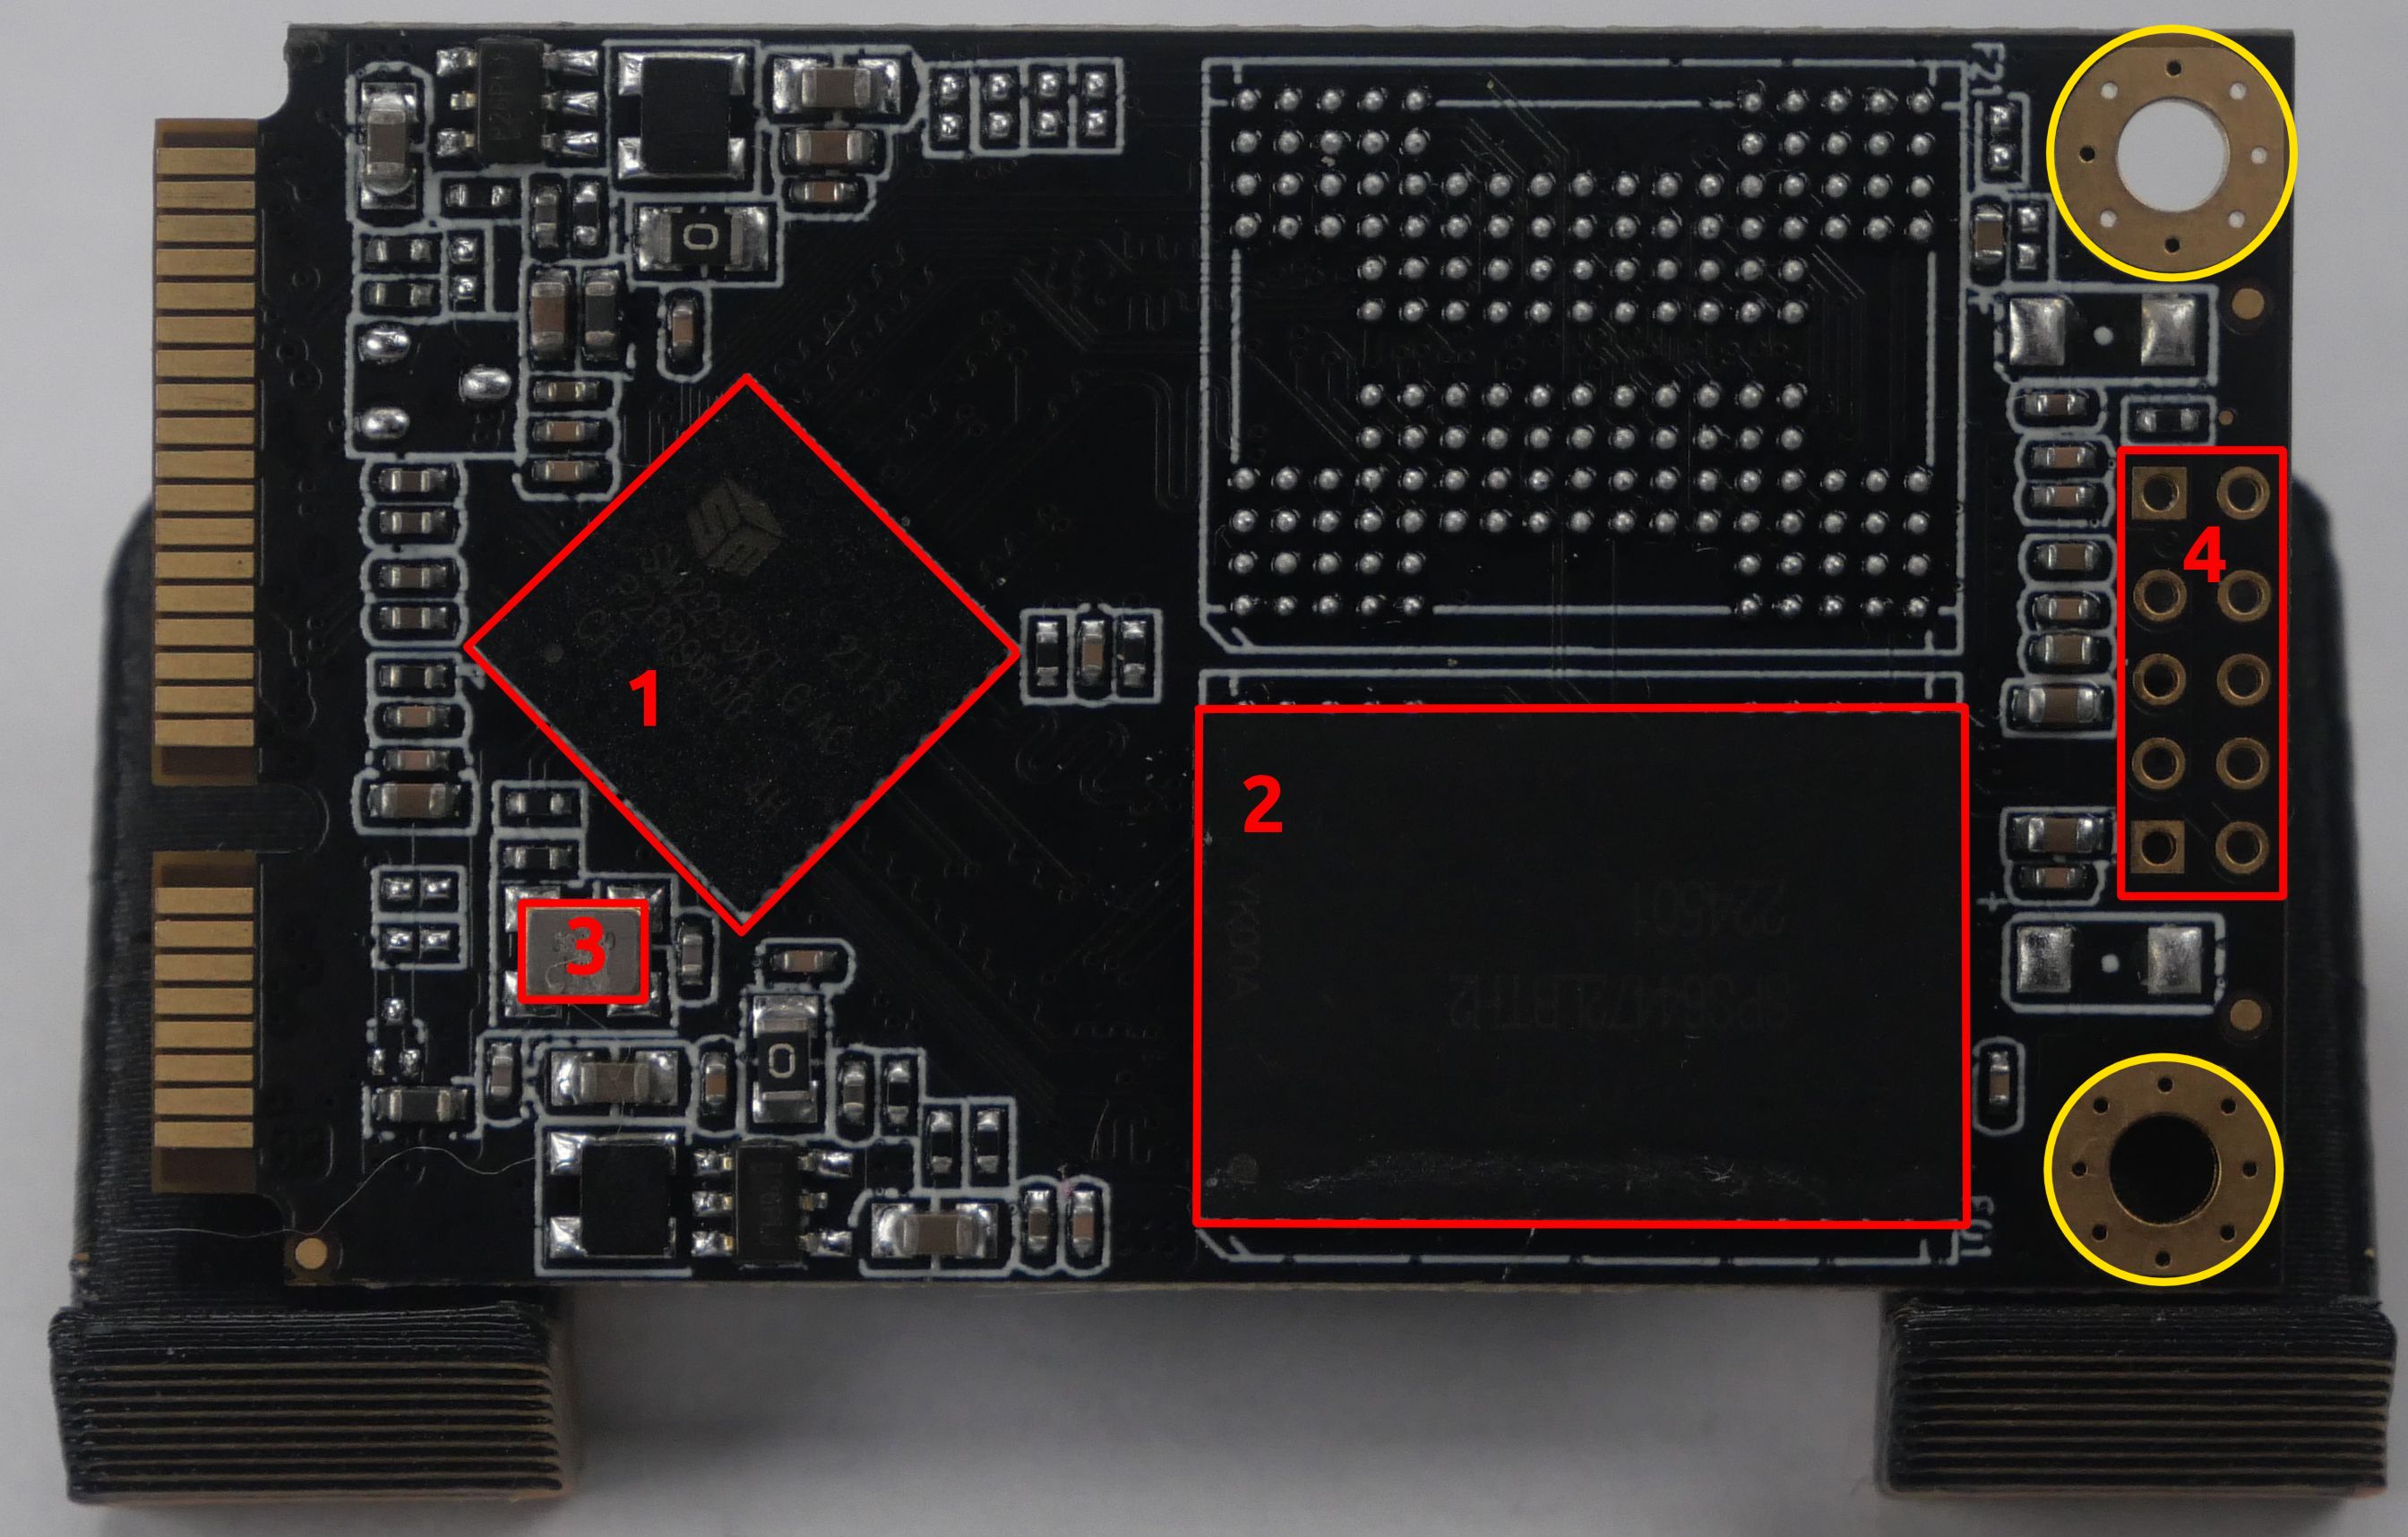
After performing this test, we determined that the following pin was ground.
Now we need to determine what logic levels are in use; remember that the Pi uses a 3.3V logic level by default, so if there are other levels in use, we will need to locate a reference voltage for the level shifter. We will use the following pinout of the SSD for reference:
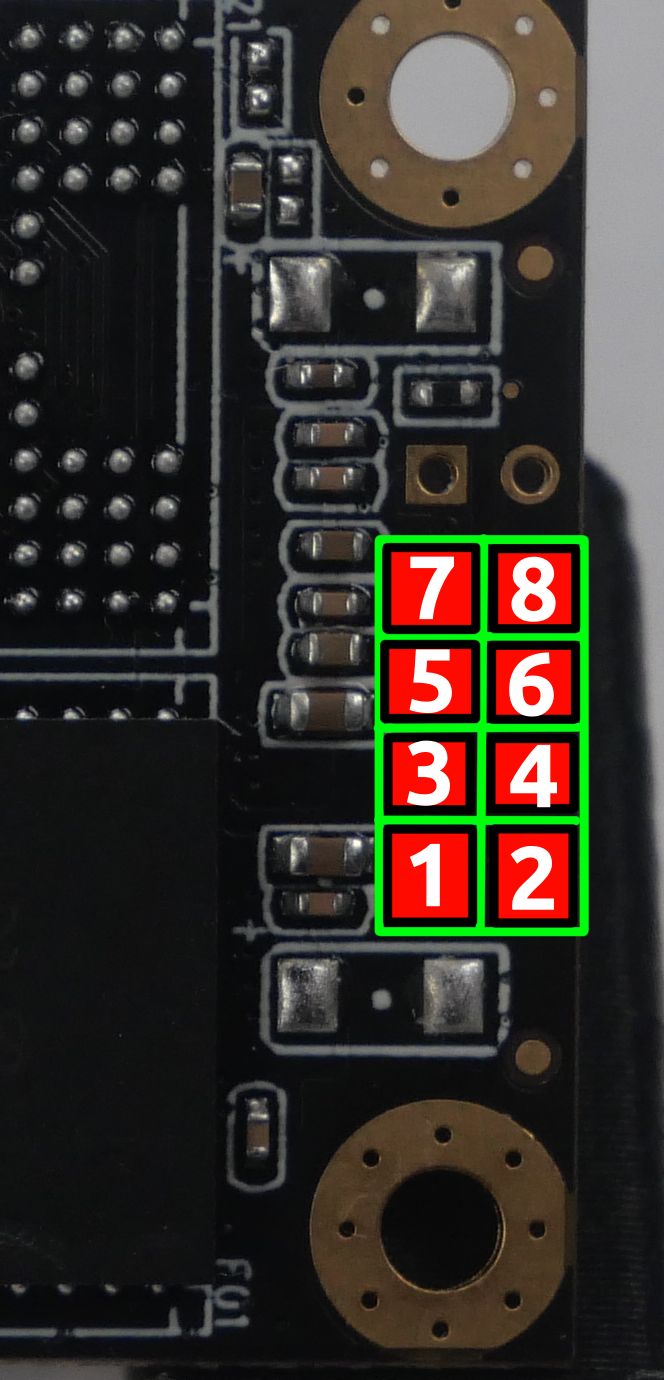
After measuring the voltages on the connector, we saw the following voltages.
- Side Note: When reversing a new target, I like to place the target platform on top of a blank sheet of paper; that way, I can quickly write down notes as I am probing/reverse engineering without having to turn away from the workspace. You can see this in the video below:
| Pin | Voltage | Usage |
|---|---|---|
| 1 | 0V | GND |
| 2 | 3.28V | ??? |
| 3 | 3.28V | ??? |
| 4 | 3.173V | ??? |
| 5 | 0.02V | ??? |
| 6 | 3.284V | ??? |
| 7 | 3.284V | ??? |
| 8 | 3.284V | ??? |
It is extremely common for voltage sources to have capacitors connected to them called decoupling capacitors. These capacitors help stabilize the power supply in the event of voltage fluctuations. From here, there are two approaches that we can take to finding out which pins might be VCC on our SSD.
-
Note what pins are connected to large capacitors near the connector
-
Monitor the voltage source on power up / power down
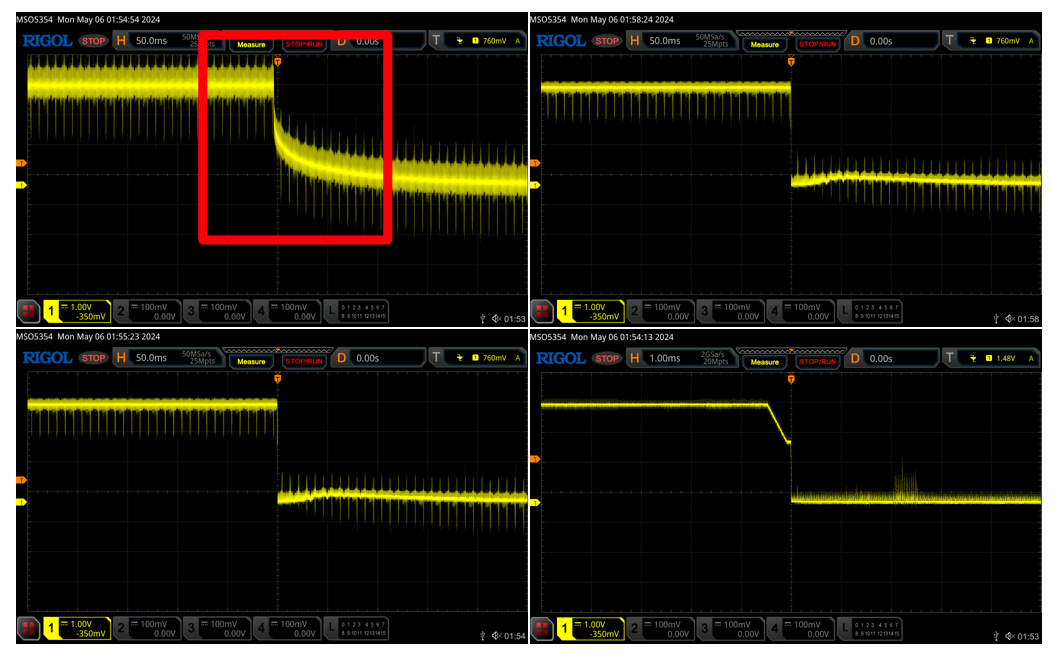
Based on the voltages we collected, we should monitor pins 2,3,4,6,7, and \8 with the oscilloscope and see how they differ. Take a look at the images below and see if you can spot the different one:
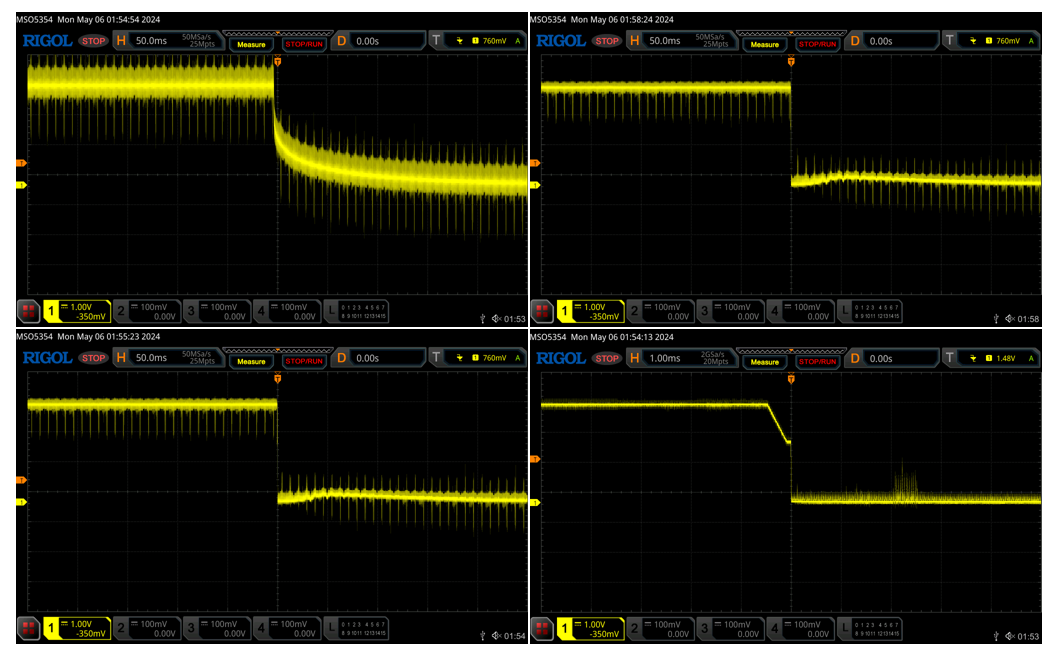
If we examine the images highlighted in green below, we see a relatively sharp drop from high to low:
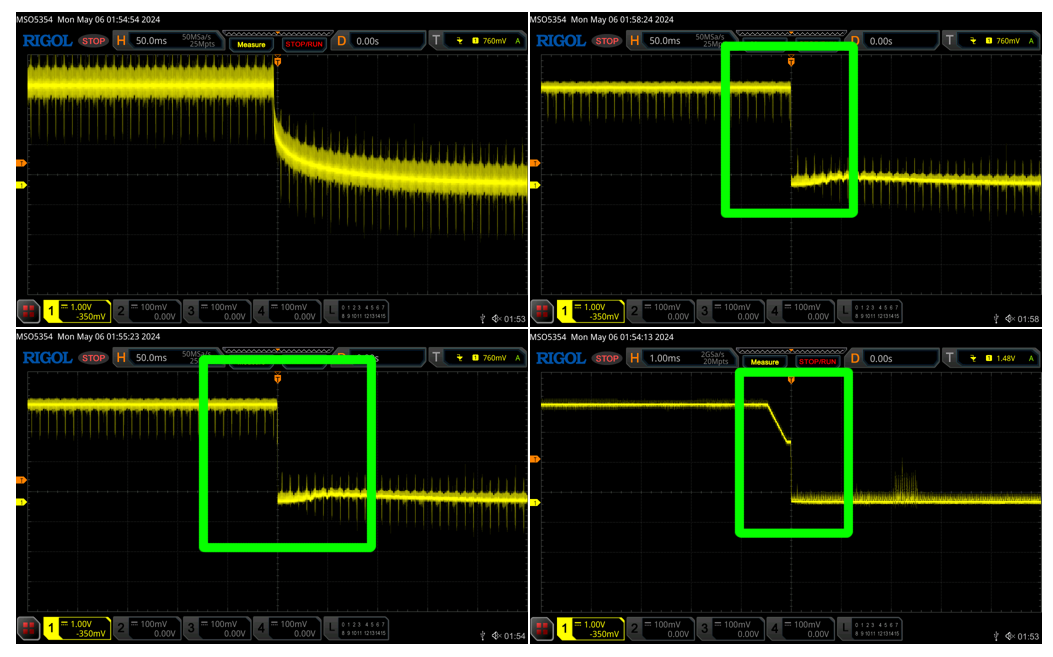
Looking closely at the images above, you may notice that image 1 has a slightly different shape when it rises and falls than the other lines. This is likely due to a capacitor being present somewhere on this line, which makes it a good candidate for VCC. This was pin two on the debug header, so we can now update our table as shown below.
| Pin | Voltage | Usage |
|---|---|---|
| 1 | 0V | GND |
| 2 | 3.28V | VCC |
| 3 | 3.28V | ??? |
| 4 | 3.173V | ??? |
| 5 | 0.02V | ??? |
| 6 | 3.284V | ??? |
| 7 | 3.284V | ??? |
| 8 | 3.284V | ??? |
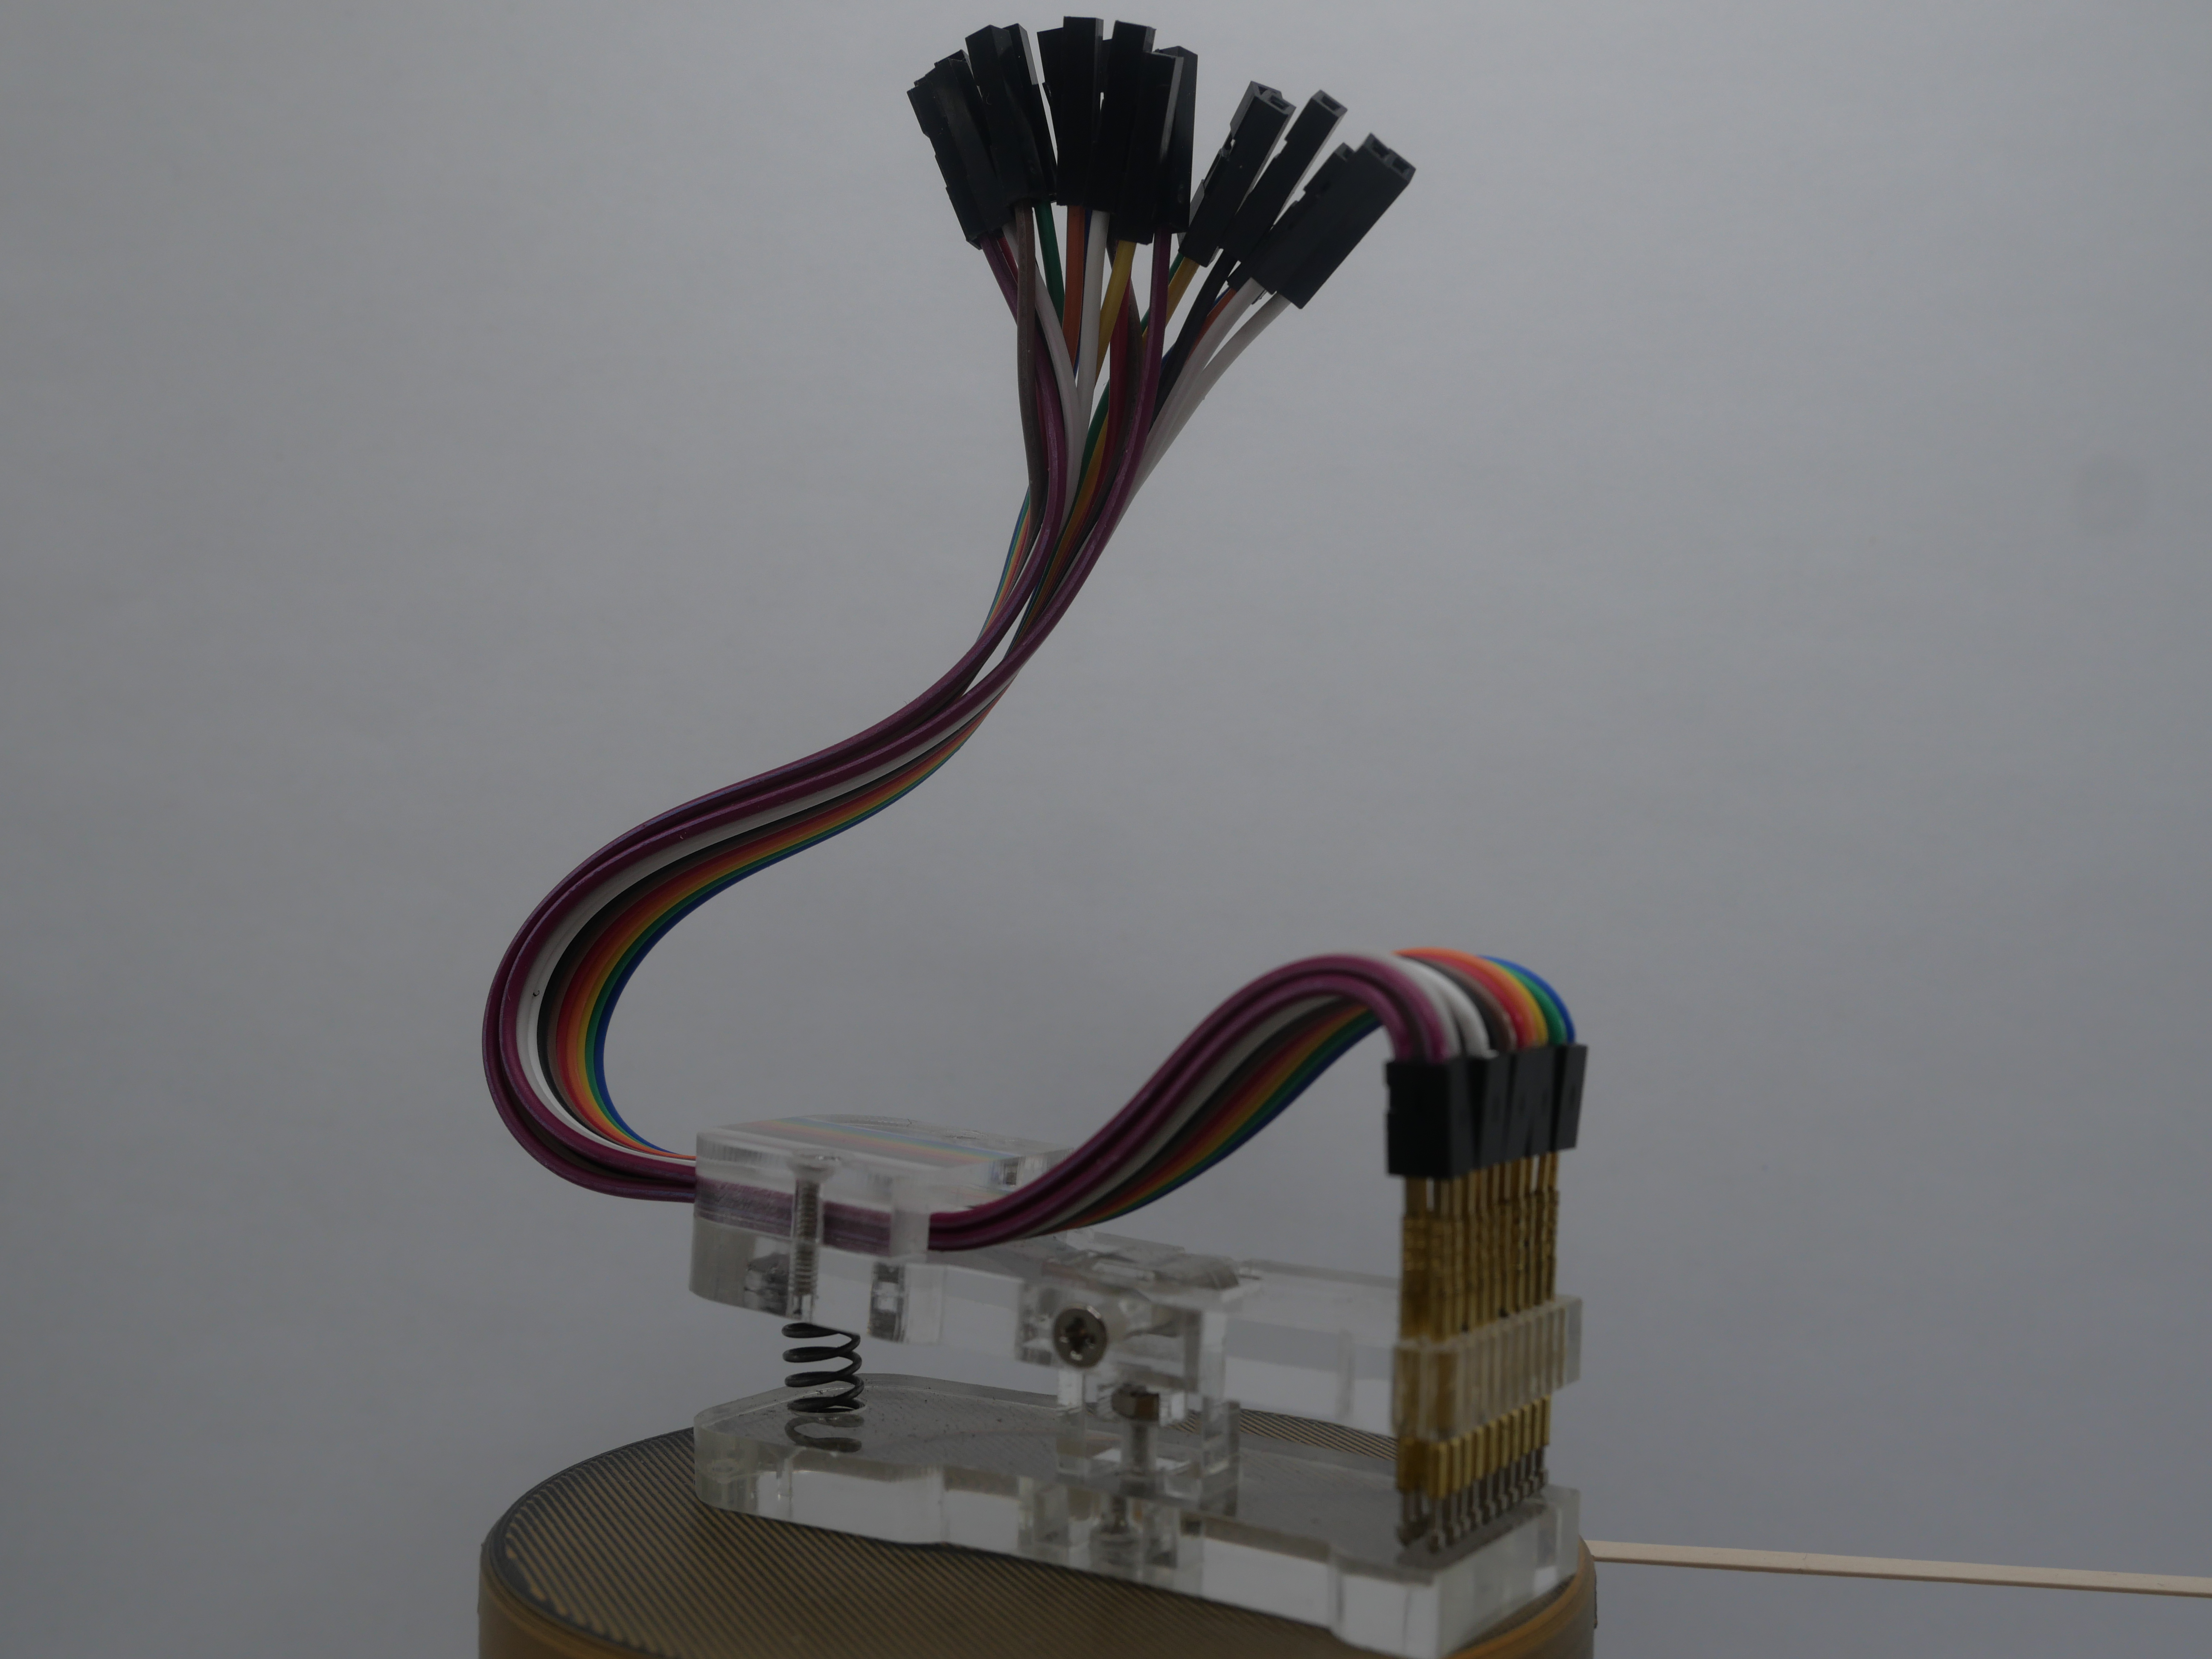
We will connect to the SSD using the clips shown in the image below, these were also purchased on AliExpress.
With this assumption, we are left with six unknown pins. Next, we can perform a JTAG IDCODE scan using the go-jtagenum tools; this will attempt to brute force all of the possible JTAG pin combinations and will report back pin configurations that report a valid ID code or pass the bypass test. If you’re unfamiliar with these scans and want to learn more about them, check out my old writeup here.
pi@voidstar:~/go/bin/linux_arm $ ./go-jtagenum -pins '{ "pin2": 2, "pin3": 3, "pin14": 14, "pin15": 15, "pin10": 10, "pin9": 9}' -command scan_idcode -delay-tck 50
defined pins: map[2:pin2 3:pin3 9:pin9 10:pin10 14:pin14 15:pin15]
================================
Starting scan for IDCODE...
FOUND! TCK:pin10 TMS:pin3 TDO:pin2
     devices:
        0x459dd1e7 (mfg: 0x0f3 (Digital Microwave), part: 0x59dd, ver: 0x4)
        0xb83b3f6f (mfg: 0x7b7 (invalid), part: 0x83b3, ver: 0xb)
        0x268b37a3 (mfg: 0x3d1 (Accelerated Memory Production Inc.), part: 0x68b3, ver: 0x2)
        0x5f5fcedf (mfg: 0x76f (invalid), part: 0xf5fc, ver: 0x5)
        0xf79d3aeb (mfg: 0x575 (invalid), part: 0x79d3, ver: 0xf)
        0x72ba6a4f (mfg: 0x527 (invalid), part: 0x2ba6, ver: 0x7)
        0x7bf1f75d (mfg: 0x3ae (Korea Uhbele International Group Ltd.), part: 0xbf1f, ver: 0x7)
        0xe7cfffaf (mfg: 0x7d7 (invalid), part: 0x7cff, ver: 0xe)
        0xb0cf6bbf (mfg: 0x5df (invalid), part: 0x0cf6, ver: 0xb)
        0xebbfb71f (mfg: 0x38f (Ericsson Modems), part: 0xbbfb, ver: 0xe)
        0xd6f7fc17 (mfg: 0x60b (invalid), part: 0x6f7f, ver: 0xd)
        0xedfe967b (mfg: 0x33d (AIM Corporation), part: 0xdfe9, ver: 0xe)
        0xfeefd88d (mfg: 0x446 (invalid), part: 0xeefd, ver: 0xf)
        0x8ef5b7ff (mfg: 0x3ff (invalid), part: 0xef5b, ver: 0x8)
        0x2fdc8f9f (mfg: 0x7cf (invalid), part: 0xfdc8, ver: 0x2)
        0x7ce9726b (mfg: 0x135 (API NetWorks), part: 0xce97, ver: 0x7)
        0x7ff76d77 (mfg: 0x6bb (invalid), part: 0xff76, ver: 0x7)
        0xb9f58fdb (mfg: 0x7ed (invalid), part: 0x9f58, ver: 0xb)
        0xe36f2bb7 (mfg: 0x5db (invalid), part: 0x36f2, ver: 0xe)
        0x757fbbdb (mfg: 0x5ed (invalid), part: 0x57fb, ver: 0x7)
        0x4fbeae5f (mfg: 0x72f (invalid), part: 0xfbea, ver: 0x4)
        0xddf6f17f (mfg: 0x0bf (Broadcom), part: 0xdf6f, ver: 0xd)
        0x1f3cefbd (mfg: 0x7de (invalid), part: 0xf3ce, ver: 0x1)
     possible nTRST: pin9, pin14 pin15
FOUND! TCK:pin10 TMS:pin14 TDO:pin15
     devices:
        0x100434b1 (mfg: 0x258 (Lorom Industrial Co. Ltd.), part: 0x0043, ver: 0x1)
     possible nTRST: pin9 pin2 pin3
================================
pi@voidstar:~/go/bin/linux_arm $ ./go-jtagenum -pins '{ "pin2": 2, "pin3": 3, "pin14": 14, "pin15": 15, "pin10": 10, "pin9": 9}' -command scan_bypass -delay-tck 50
defined pins: map[2:pin2 3:pin3 9:pin9 10:pin10 14:pin14 15:pin15]
================================
Starting scan for pattern 0110011101001101101000010111001001
FOUND! TCK:pin10 TMS:pin14 TDO:pin15 TDI:pin9, possible nTRST: pin2 pin3
^C
pi@voidstar:~/go/bin/linux_arm $ ./go-jtagenum -pins '{ "pin2": 2, "pin3": 3, "pin14": 14, "pin15": 15, "pin10": 10, "pin9": 9}' -command scan_idcode -delay-tck 50
defined pins: map[2:pin2 3:pin3 9:pin9 10:pin10 14:pin14 15:pin15]
================================
Starting scan for IDCODE...
FOUND! TCK:pin10 TMS:pin14 TDO:pin15
     devices:
        0x100434b1 (mfg: 0x258 (Lorom Industrial Co. Ltd.), part: 0x0043, ver: 0x1)
     possible nTRST: pin2 pin3 pin9
Before we move forward, let’s talk about the output that we’re seeing above. You’ll notice that go-jtagenum discovered what it believes to be multiple possible pin mappings, some of which contain more “devices” than others. While it is possible that there can be various devices on a JTAG scan chain, we know that this device is pretty straightforward and will not likely have 10+ devices. This is the one drawback of the IDCODE scan; it simply checks to see if data is changing** on the assumed TDO port, which can lead to many false positives. However, the entry displaying just one IDCODE value looks promising; we can further investigate this TAP using the BYPASS scan.
We can attempt to verify these results with a bypass scan. The BYPASS scan attempts to leverage the BYPASS instruction of the JTAG TAP which directly links the TDI and TDO lines. The scan attempts to enter the BYPASS instruction, provides a unique bit pattern on TDI, and monitors for that same pattern on TDO. If the data sent on TDI matches what is read on TDO, then the scan has determined the correct pinout. The results of the BYPASS scan can be seen below:
['defined pins: map[2:IO_2 3:IO_3 9:IO_9 10:IO_10 14:IO_14 15:IO_]',
 '================================',
 'Starting scan for pattern 0110011101001101101000010111001001',
 'active, TCK:IO_10 TMS:IO_14 TDO:IO_ TDI:IO_2, wrong data received (0000000000000000000000000000000000)',
 ' try adjusting frequency, delays, pullup, check hardware connectivity',
 'FOUND! TCK:IO_10 TMS:IO_14 TDO:IO_ TDI:IO_9, possible nTRST: IO_3 IO_2 ',
 '================================']
Going back to our table of pin usages, we now know the following:
| Pin | Voltage | Usage |
|---|---|---|
| 1 | 0V | GND |
| 2 | 3.28V | VCC |
| 3 | 3.28V | ??? |
| 4 | 3.173V | ??? |
| 5 | 0.02V | TDO |
| 6 | 3.284V | TMS |
| 7 | 3.284V | TDI |
| 8 | 3.284V | TCK |
Note: We are not required to use the labeled JTAG pins on the PiFex for JTAG operations, they are configurable via OpenOCD.
So now that we know what the pins are, we need to use them to access the test access port (TAP) on the device. There is only one problem: we know our pins, but now we need to figure out how to actually use them. We can now write to the Instruction Register (IR) and Data Registers (DR), but without knowing what to write to them, knowing the JTAG pinout is largely useless. Before we move forward, we need to figure out two things:
- What type of CPU is this?
- Can we use any open-source tools to interact with it?
To determine what type of CPU we’re dealing with, we can start with the ID. We can extract this via a tool called UrJTAG.
UrJTAG for Reverse Engineers
UrJTAG is an open-source tool designed for performing low-level JTAG operations. This tool allows one to programmatically read and write the instruction register and corresponding data registers when connected to a JTAG TAP. It was originally designed to enable developers to use other JTAG tooling besides those provided by the original component manufacturer. Because of this tool’s low-level instrumentation and introspection, it is also beneficial to us as reverse engineers when examining a new TAP.
pi@voidstar:~/pifex/software/urjtag-2021.03 $ sudo ./src/apps/jtag/jtag
UrJTAG 2021.03 #
Copyright (C) 2002, 2003 ETC s.r.o.
Copyright (C) 2007, 2008, 2009 Kolja Waschk and the respective authors
UrJTAG is free software, covered by the GNU General Public License, and you are
welcome to change it and/or distribute copies of it under certain conditions.
There is no warranty for UrJTAG.
warning: UrJTAG may damage your hardware!
Type "quit" to exit, "help" for help.
jtag> cable gpio tck=10 tdi=9 tms=14 tdo=15
Initializing GPIO JTAG Chain
jtag> idcode
Reading 0 bytes of idcode
Read 10110001(0xb1) 00110100(0x34) 00000100(0x04) 00010000(0x10) 00000000(0x00) 00000000(0x00) 00000000(0x00) 00000000(0x00)
jtag> detect
IR length: 4
Chain length: 1
Device Id: 00010000000001000011010010110001 (0x100434B1)
  Unknown manufacturer! (01001011000) (/usr/local/share/urjtag/MANUFACTURERS)
jtag> discover
Detecting IR length ... 4
Detecting DR length for IR 1111 ... 1
Detecting DR length for IR 0000 ... -1
Detecting DR length for IR 0001 ... warning: TDO seems to be stuck at 0
-1
Detecting DR length for IR 0010 ... 1
Detecting DR length for IR 0011 ... 1
Detecting DR length for IR 0100 ... 1
Detecting DR length for IR 0101 ... 1
Detecting DR length for IR 0110 ... 1
Detecting DR length for IR 0111 ... 1
Detecting DR length for IR 1000 ... 4
Detecting DR length for IR 1001 ... 4
Detecting DR length for IR 1010 ... 32
Detecting DR length for IR 1011 ... 32
Detecting DR length for IR 1100 ... 32
Detecting DR length for IR 1101 ... 1
Detecting DR length for IR 1110 ... 1
jtag>
Using the data that we gathered from our previous scans, we can set up our cable in UrJTAG as follows:
cable gpio tck=10 tdi=9 tms=14 tdo=15
This tells UrJTAG that we are connected to our target via GPIO pins on a Linux device; we then follow that with GPIO pin assignments for each JTAG signal. After defining our cable, we can run the detect, idcode, and discover commands, which will attempt to learn more about the TAP that it is connected to, resulting in the output above.
After running a UrJTAG scan, we now know the following:
- How many available DRs are present
- The width of all of the available DRs
- Confirmation of the CPU ID
- Confirmation of the JTAG pinout
This is a lot of great information that we did not have at the beginning of this post, but what can we do with it? In order to read memory, set breakpoints, etc., we need to know more about how to interact with these registers. Without a datasheet, this is a difficult task. However, there are other open-source tools that we can leverage before attempting black box reverse engineering of the JTAG TAP.
OpenOCD for Reverse Engineers
Armed with this information, we can search the ID and determine that this chip uses the ARCompact architecture, and if we check the configuration files for OpenOCD, we can see this ID code in the following files:
pi@voidstar:~/pifex/software/openocd/tcl/cpu/arc $ ls
common.tcl em.tcl  hs.tcl  v2.tcl
Let’s see what CPUs reference these files, this will give us a better understanding of how to write a generic OpenOCD config file for an ARCompact target.
pi@voidstar:~/pifex/software/openocd/tcl $ grep -r "arc/common" *
cpu/arc/v2.tcl:source [find cpu/arc/common.tcl]
pi@voidstar:~/pifex/software/openocd/tcl $ grep -r "arc/v2" *
cpu/arc/em.tcl:source [find cpu/arc/v2.tcl]
cpu/arc/hs.tcl:source [find cpu/arc/v2.tcl]
pi@voidstar:~/pifex/software/openocd/tcl $ grep -r "arc/hs" *
target/snps_hsdk.cfg:source [find cpu/arc/hs.tcl]
target/snps_hsdk_4xd.cfg:source [find cpu/arc/hs.tcl]
pi@voidstar:~/pifex/software/openocd/tcl $ grep -r "arc/em" *
target/snps_em_sk_fpga.cfg:source [find cpu/arc/em.tcl]
pi@voidstar:~/pifex/software/openocd/tcl $
It looks like there is a few target file that uses these config files:
snps_hsdksnps_hsdk_4xdsnps_em_sk_fpga
Let’s do one more quick search before trying to write our own config file; if we search for the above config files, we find the following:
pi@voidstar:~/pifex/software/openocd/tcl/board $ ls -lathr *snps*
-rw-r--r-- 1 pi pi 411 May 4 18:20 snps_hsdk_4xd.cfg
-rw-r--r-- 1 pi pi 416 May 4 18:20 snps_hsdk.cfg
-rw-r--r-- 1 pi pi 615 May 4 18:20 snps_em_sk_v2.2.cfg
-rw-r--r-- 1 pi pi 659 May 4 18:20 snps_em_sk_v2.1.cfg
-rw-r--r-- 1 pi pi 555 May 4 18:20 snps_em_sk_v1.cfg
-rw-r--r-- 1 pi pi 612 May 4 18:20 snps_em_sk.cfg
All of these config files are very straightforward and essentially import one of the three files located in the target folder. Taking some basic information from the target folder we will construct our own OpenOCD as shown below:
source [find cpu/arc/hs.tcl]
transport select jtag
# We don't know much about this CPU at the moment, until we do we'll assume that
# it has one core that we will index at 0 and that the dbg
set _coreid 0
set _dbgbase 0
# CHIPNAME will be used to choose core family (600, 700 or EM). As far as
# OpenOCD is concerned EM and HS are identical.
set _CHIPNAME arc-em
set _TARGETNAME $_CHIPNAME.cpu
# Create the TAP using the information we extracted via UrJTAG and the IDCODE scan
jtag newtap $_CHIPNAME cpu -irlen 4 -ircapture 0x1 -expected-id 0x100434b1
# OpenOCD requires us to create a target for debugging the target; most of the
# provided arguments are variable names that we've already set up; however, we must
# specify the architecture; in this case we'll use ARCv2, the assumed architecture of
# this CPU
target create $_TARGETNAME arcv2 -chain-position $_TARGETNAME
# Next we configure our initial guesses for the coreid and base address for debug regions of memory
# We're not using these at the moment, but perhaps after further reversing, we'll learn more
# and can come back and update them
$_TARGETNAME configure -coreid 0
$_TARGETNAME configure -dbgbase 0
# Here, we are defining what to do when a reset event occurs
$_TARGETNAME configure -event reset-assert "arc_hs_reset $_TARGETNAME"
# The following two lines were pulled from the ARC-specific examples in OpenOCD
# These seem to be used across all ARCompact variants supported by OpenOCD
arc_hs_init_regs
$_TARGETNAME arc cache l2 auto 1
This file will let OpenOCD know what pins to use on the Raspberry Pi and the specifics about our target CPU. The following config file can be used to configure the Raspberry Pi GPIO pins.
source [interface/raspberrypi-native.cfg]

transport select jtag

adapter gpio tck -chip 0 10
adapter gpio tms -chip 0 14
adapter gpio tdi -chip 0 9
adapter gpio tdo -chip 0 15

adapter speed 100
If we run OpenOCD using these config files as an argument, we see the following:
pi@voidstar:~/pifex/ssd-example $ openocd -f raspberrypi-io.cfg -f ssd_example.cfg
Open On-Chip Debugger 0.12.0+dev-01573-gbc9ca5f4a (2024-05-04-18:24)
Licensed under GNU GPL v2
For bug reports, read
        http://openocd.org/doc/doxygen/bugs.html
adapter speed: 100 kHz
Warn : Transport "jtag" was already selected
Info : target has l2 cache enabled is enabled
Info : Listening on port 6666 for tcl connections
Info : Listening on port 4444 for telnet connections
Info : BCM2835 GPIO JTAG/SWD bitbang driver
Info : clock speed 100 kHz
Info : JTAG tap: arc-em.cpu tap/device found: 0x100434b1 (mfg: 0x258 (ARC International), part: 0x0043, ver: 0x1)
Info : [arc-em.cpu] Examination succeed
Info : starting gdb server for arc-em.cpu on 3333
Info : Listening on port 3333 for gdb connections
Success! It looks like we have connected to the JTAG TAP of this SSD using OpenOCD. Next, we will use this to read memory and single-step through the running firmware on the SSD itself.
Reading Memory with OpenOCD
Now that we have a working OpenOCD connection, we can read memory using the mdw and dump_image commands. We will dump a small region of memory as a test:
pi@voidstar:~ $ telnet localhost 4444
Trying ::1...
Trying 127.0.0.1...
Connected to localhost.
Escape character is '^]'.
Open On-Chip Debugger
> mdw 0 100
0x00000000: 0000214a 0000224a 0000234a 0000244a 0000254a 0000264a 0000274a 1000204a
0x00000020: 1000214a 1000224a 1000234a 1000244a 1000254a 1000264a 1000274a 2000204a
0x00000040: 2000214a 2000224a 2000234a 2000244a 2000254a 2000264a 2000274a 3000204a
0x00000060: 3000214a 0000204a 3f80240a 80001000 3f80220a 26001000 3f80230a 80001000
0x00000080: 3000254a 3000264a 3000274a 7080266b 00000000 70c0266b 00000000 0f802020
0x000000a0: 05b00000 00402069 7000264a 7000264a 7000264a ffcf07f1 500071cf 1154a000
0x000000c0: 70cf0802 05f81000 00a01800 08001000 00201954 78e07ee0 71cfc5e1 00005000
0x000000e0: 0880110c 500072cf b8e4a000 11dcf47f b8810880 002219dc 08001204 1a04b880
0x00000100: db000020 00e01a4c 0fa01a44 80000000 0fff208a 00201a58 08001268 00201a68
0x00000120: 08001274 0fc32086 0a822085 00201a74 500075cf 1517a0a8 20861880 b88000fc
0x00000140: 10221d17 0800125c 0f802004 1feefff8 00201a5c 0800125c 0f802004 1fef8ff8
0x00000160: 1a5cb89c d8010020 0022190d 08001204 1a04b881 15140020 b8841880 10221d14
0x00000180: 500071cf 110d07f0 b8840880 0022190d
> dump_image
dump_image filename address size
> dump_image mem-test.bin 0 0x100000
> dumped 1048576 bytes in 264.823212s (3.867 KiB/s)
Next, we’ll want to review this memory dump to make sure that it’s accurate. This creates an interesting problem: we don’t know what the memory contents will look like at address 0, especially since we don’t have a datasheet or an example firmware image. In this case, we will start by running strings on the resulting binary; some of these results can be seen below:
pi@voidstar:~/pifex/ssd-example $ strings mem-test.bin | less
02023042MS2295CAX--XYYYYYYYY
SM2259PARA
SM2259BT
xSM2259BTDS
SM2259AC20200324
L^r|
%`)$5a94
SMISSDRetryTable
Device_FW_Authentication
xFW_MAC_Key
SM2259ROMCodeTagZZZZ
We’ve got human-readable strings, which is a great sign! We also have the part number for the CPU in these strings, which leads me to believe we’ve correctly extracted this memory region via OpenOCD. However, we need to learn more about this processor and what areas might interest us. We can figure this out using OpenOCD to attach to the target CPU via GDB.
Debugging with OpenOCD
Now that we have OpenOCD connected to our target, we can attempt to debug the target via GDB. However, this does not come without some strings attached; we will need to compile a version of GDB capable of targeting the ARCompact architecture. Luckily for us, the good folks over at Synopsis have released a port of binutils for the ARCompact architecture. We can clone the repository here and build it on the Raspberry Pi (Note: see the appendix for instructions on how to build this software).
After building GDB and attempting to connect to the GDB server presented by OpenOCD, we see the following:
(gdb) x/10i $pc
=> 0x22b0: brne_s r0,0,10 ;0x22ba
   0x22b2: ldb.di r2,[r18,3]
   0x22b6: btst_s r2,0x7
   0x22b8: beq_s -282 ;0x219e
   0x22ba: ldb r4,[0x852]
   0x22c2: bbit0.t r4,0,18 ;0x22d2
   0x22c6: ldb.di r2,[r13,113]
   0x22ca: bset_s r2,r2,0
   0x22cc: stb.di r2,[r13,113]
   0x22d0: b_s 12 ;0x22dc
(gdb) i r
r0 0x0 0
r1 0x101 257
r2 0x10004aac 268454572
r3 0x0 0
r4 0x100014b6 268440758
r5 0x50100000 1343225856
r6 0x50100000 1343225856
r7 0x10 16
r8 0x0 0
r9 0x0 0
r10 0x0 0
r11 0x4 4
r12 0x0 0
r13 0x50000000 1342177280
r14 0x0 0
r15 0x0 0
r16 0x5000a000 1342218240
Success! Using OpenOCD and GDB, we are able to single-step through the firmware and read register values. These register values tell us more about potential memory regions of interest that we can read out, specifically 0x50000000 and 0x10000000. As a final test, we will load the area of memory we extracted initially into Ghidra and see if the instructions match what we see in GDB.
Loading the Firmware into Ghidra
While the current Ghidra release does not support ARCompact, a wonderful fork is being maintained here. We can build this and use it to analyze our firmware image.
If we look at offset 0 in the firmware image, we have what appears to be an interrupt vector table of some sort:
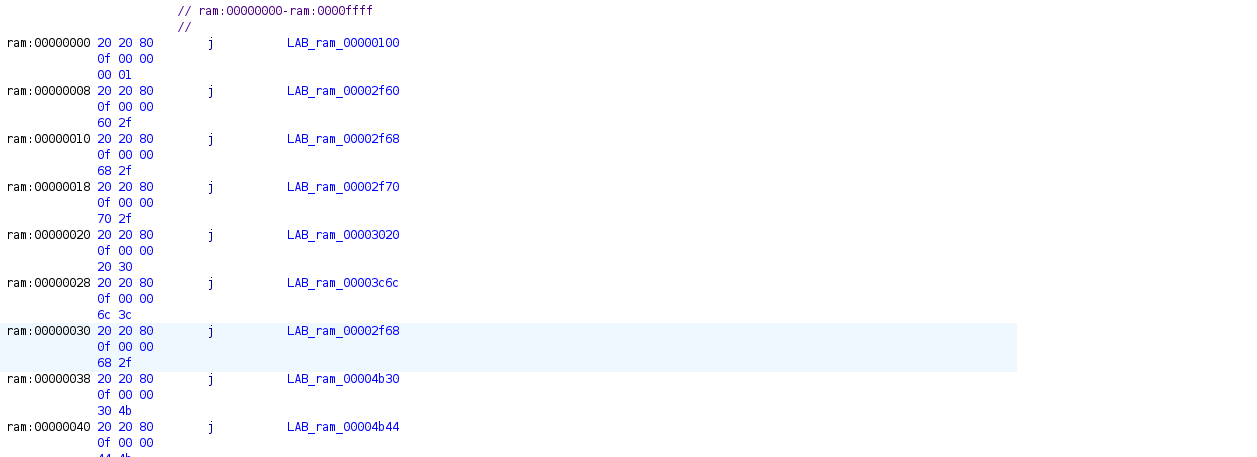
If we look a little further at the image, we can see that there are some branch instructions for a region that we’ve not extracted yet. We also see that the two areas we previously identified (0x50000000 and 0x10000000) are being referenced as well. These are likely internal/external SRAM regions, while the area starting around 0x4007000 appears to be used as code.
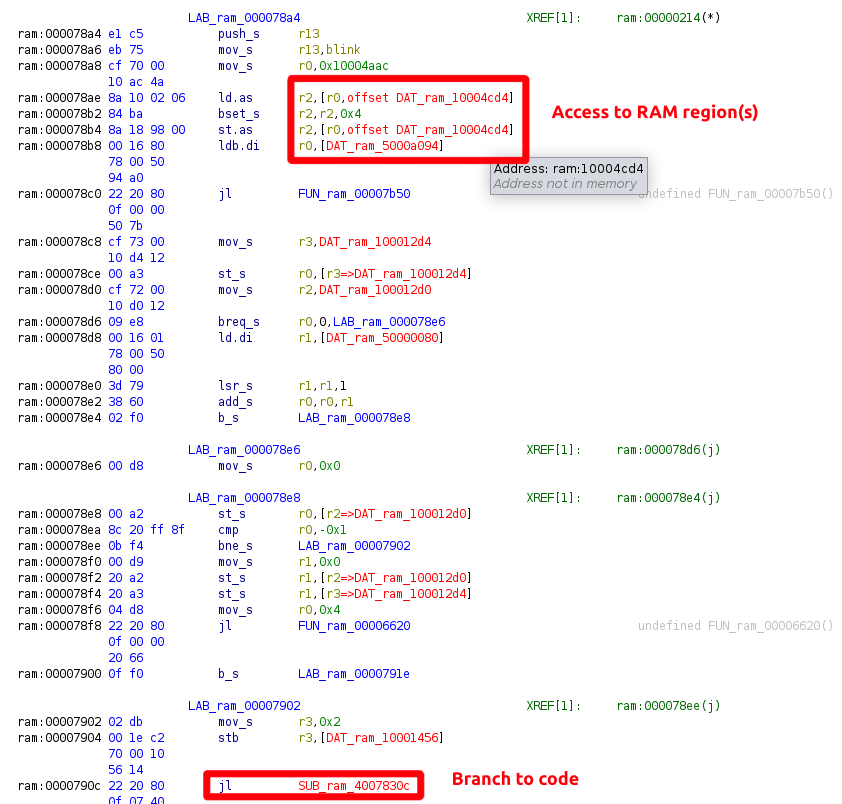
Let’s try to extract that region, load it into our Ghidra database, and see if the results make sense. First, we’ll dump the region out using OpenOCD, as shown below:
dump_image 0x40070000.bin 0x40070000 0x100000
We can then import it into our Ghidra database, resulting in the following:
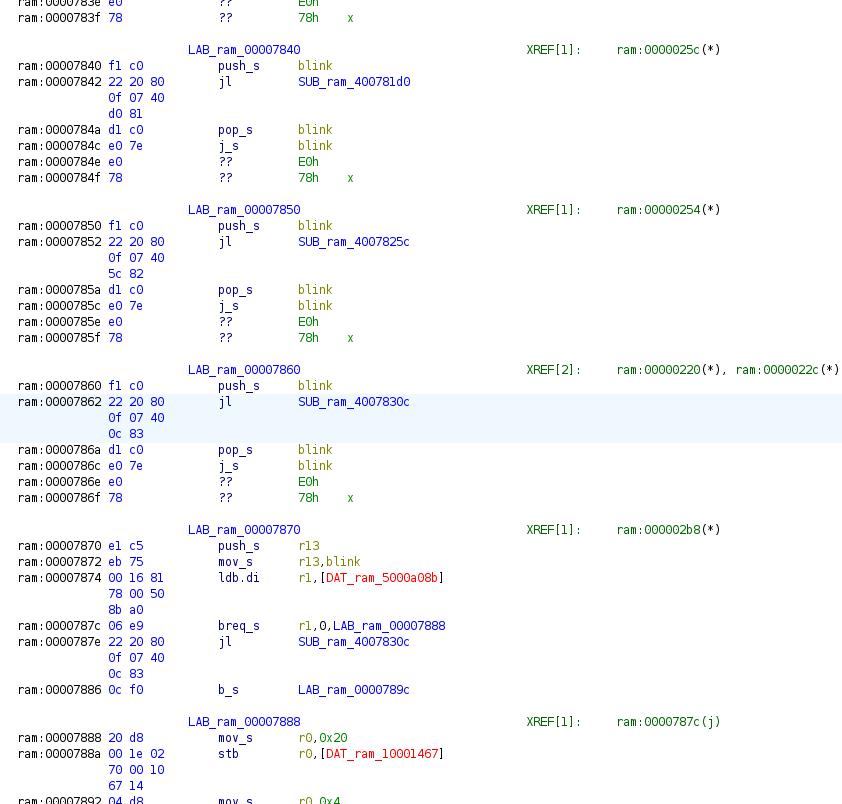
Success: It looks like we have code in this region, and it disassembles properly.
From here, we now have the following primitives available to us on the SSD:
- Memory R/W
- Control Flow Monitoring / Modifications
- Register Reads/Writes
This puts one in a perfect position to do more software research, look for bugs or errors in their code, or even attempt to modify the firmware or reverse engineer the update process!
Conclusion
If you’ve read this far, thank you for taking the time to read it all. This probably should have been two separate posts!
With this blog post, we introduced the PiFex hardware and software tools. These tools utilize open-source software and commercial hardware to aid in embedded device assessments. We then demonstrated how to use these tools to discover and enumerate an undocumented JTAG TAP on an SSD. Using this TAP, we were able to read memory and control execution on the target, giving us full control over the device.
If you want to stay up to date on the official release, sign up for our mailing list here, or you can order one here
If you’re interested in a private training at your organization, please don’t hesitate to contact us. We also have our only public training available this year at RingZer0 DoubleDown Vegas
A big thanks goes out to Nash Reilly for his help and review of the initial hardware design; you can check out his blog here and his other two job sites below:
Appendix
Building Binutils
./configure --target=arc-elf32 --disable-werror
make